비중심합성계획을 이용한 순차적 실험방법에 관한 연구
A Study on Sequential Design of Experiments Using Non-Central Composite Designs
Article information
Trans Abstract
Purpose
A noncentral composite design method is to be developed to explore farther region for the first factorial design. A general guideline for sequential experimentation is provided.;
Methods
(1) A non-overlapping noncentral composite design (NNCD) is developed, in which the second factorial design shares one design point that indicates the best response value in the first factorial design. (2) Four composite designs are compared in terms of the four design evaluation criteria, which are D-, A, G, and I-optimality. (3) A follow-up design strategy is suggested based on the interaction effect, direction of improvement, number of factors.;
Results
(1) NNCD and model building method are presented, which is useful for exploring farther region from first factorial design block. (2) The performances of the four composite designs are compared. (3) A follow-up design strategy is suggested.;
Conclusion
(1) NNCD will be useful to explore farther region for the first factorial design. (2) A follow-up design strategy can be beneficial to the experimental practitioners for product and process design and improvement.
1. Introduction
Design of experiments(DOE) is a useful statistical tool in product and process design and improvement. Sequential experimentation is useful for efficient implementation of DOE. Box and Wilson(1951) introduced response surface methodology(RSM) using the sequential experimentation framework with steepest ascent, central composite design, and canonical analysis of quadratic models. Where sequential experimentation is possible, the success of RSM is due largely to the wide range of design choices. Box(1992) suggested several sequential assembly methods from initial 2-level fractional factorial designs - adding another fraction, replicating existing design point runs, shifting levels of existing factors, and dropping and/or adding factors, which was re-emphasized by Vining(2011). Recently, Byun, et al.(2019) implemented adding additional design point to improve the quality characteristic for a mixture experiment. Lee et al.(2020) presented a design space approach to improve both quality and productivity simultaneously. Chung and Lim(2020) proposed a fraction of design space(FDS) plot apporach to compare the efficiency of mixture designs.
Although central composite design(CCD) has been the most popular for augmenting two-level factorial design when there is a curvature, other noncentral composite designs have been proposed. Box and Wilson(1951) and Box(1954) recommended adding just one axial point to each axis when the initial first-order design shows the region of interest lies toward one of the corners of the factorial design. In this case, the factorial design block can be augmented with further axial points to form a noncentral composite design. The advantage of this approaches is a better fit for one’s model in the region of greatest interest. Box et al.(2005) presented some noncentral composite designs for 2-level and 3-level factors with design matrices and experimental points in design spaces. However, these designs consist of the first factorial design block and the second block which is not a factorial design. Lucas(1974) referred to such designs as asymmetric composite designs(ACD) and generalized them by locating the k axial points. He wrote, “In practice, the star points are added to the corner of the hypercube which is closest to the optimum value.” Mee(2001) proposed overlapping noncentral composite designs(ONCD) in which the first factorial design is augmented with a second factorial design. ONCD has the advantage over CCD, since it can help estimate a secon-order model by moving in the the direction of improvement. In ONCD the size of the second design block is the same as the first factorial design block, and the second design is located in the direction of improvement. Mee(2001) recommends a shift in each factor by 1 in coded unit for a proper amount of overlapping and better precision when it comes to the estimation of quadratic effects. Edwards and Fuerte(2011) proposed a Baysian reliability method to apply ONCD for multiple response problems.
When the experimenter wants to explore the region of improvement near the first design block, ONCD is a reasonable noncentral composite design. However, if farther region is to be explored, a new design strategy is needed. In this paper, non-overlapping noncentral composite design(NNCD) is proposed to explore farther region of improvement. The second factorial design is augmented to the first factorial design, and the first and second designs share one design point. NNCD has another advantage over ONCD. The experimenter can check the difference between the first and second design blocks, since there are two experimental results, one from the first design and the other from the second design at one design point.
In Section 2 we first present the sequential nature of response surface designs, and then address the general approach of sequential experimentation. The methods of steepest ascent, CCD, ACD, and ONCD are also explained. Then the NNCD is proposed in Section 3 along with an illustrative example. In Section 4, the performance of NNCD is compared with CCD, ACD, and ONCD in terms of the estimation and prediction capability criteria such as D-, A-, G-, and I-optimality. Follow-up design strategy is presented in Section 5, and then the final section summarizes the proposed method and suggests future research.
2. Sequential Experimentation
There are generally three steps in systematically applying design of experiments to product and process design and improvement. First, screening experiments are used to identify important factors, and these factors are then used to investigate the design region. When the experimenter reaches a region near the optimum, the second-order design is implemented to determine optimal design(Myers et al., 2009). After the screening experiment, when the important factors have been identified, we need to determine whether the current region of the experiment is far from the optimum, like point A of <Figure 1>, or it is near the optimum, like point B in <Figure 1>. If the current design point is in the vicinity of point A, we need to move toward the optimum through systematic design of experiments. The most popular approach is the method of steepest ascent, which is based on the direction of efficient improvement calculated using the linear terms of the independent factors.
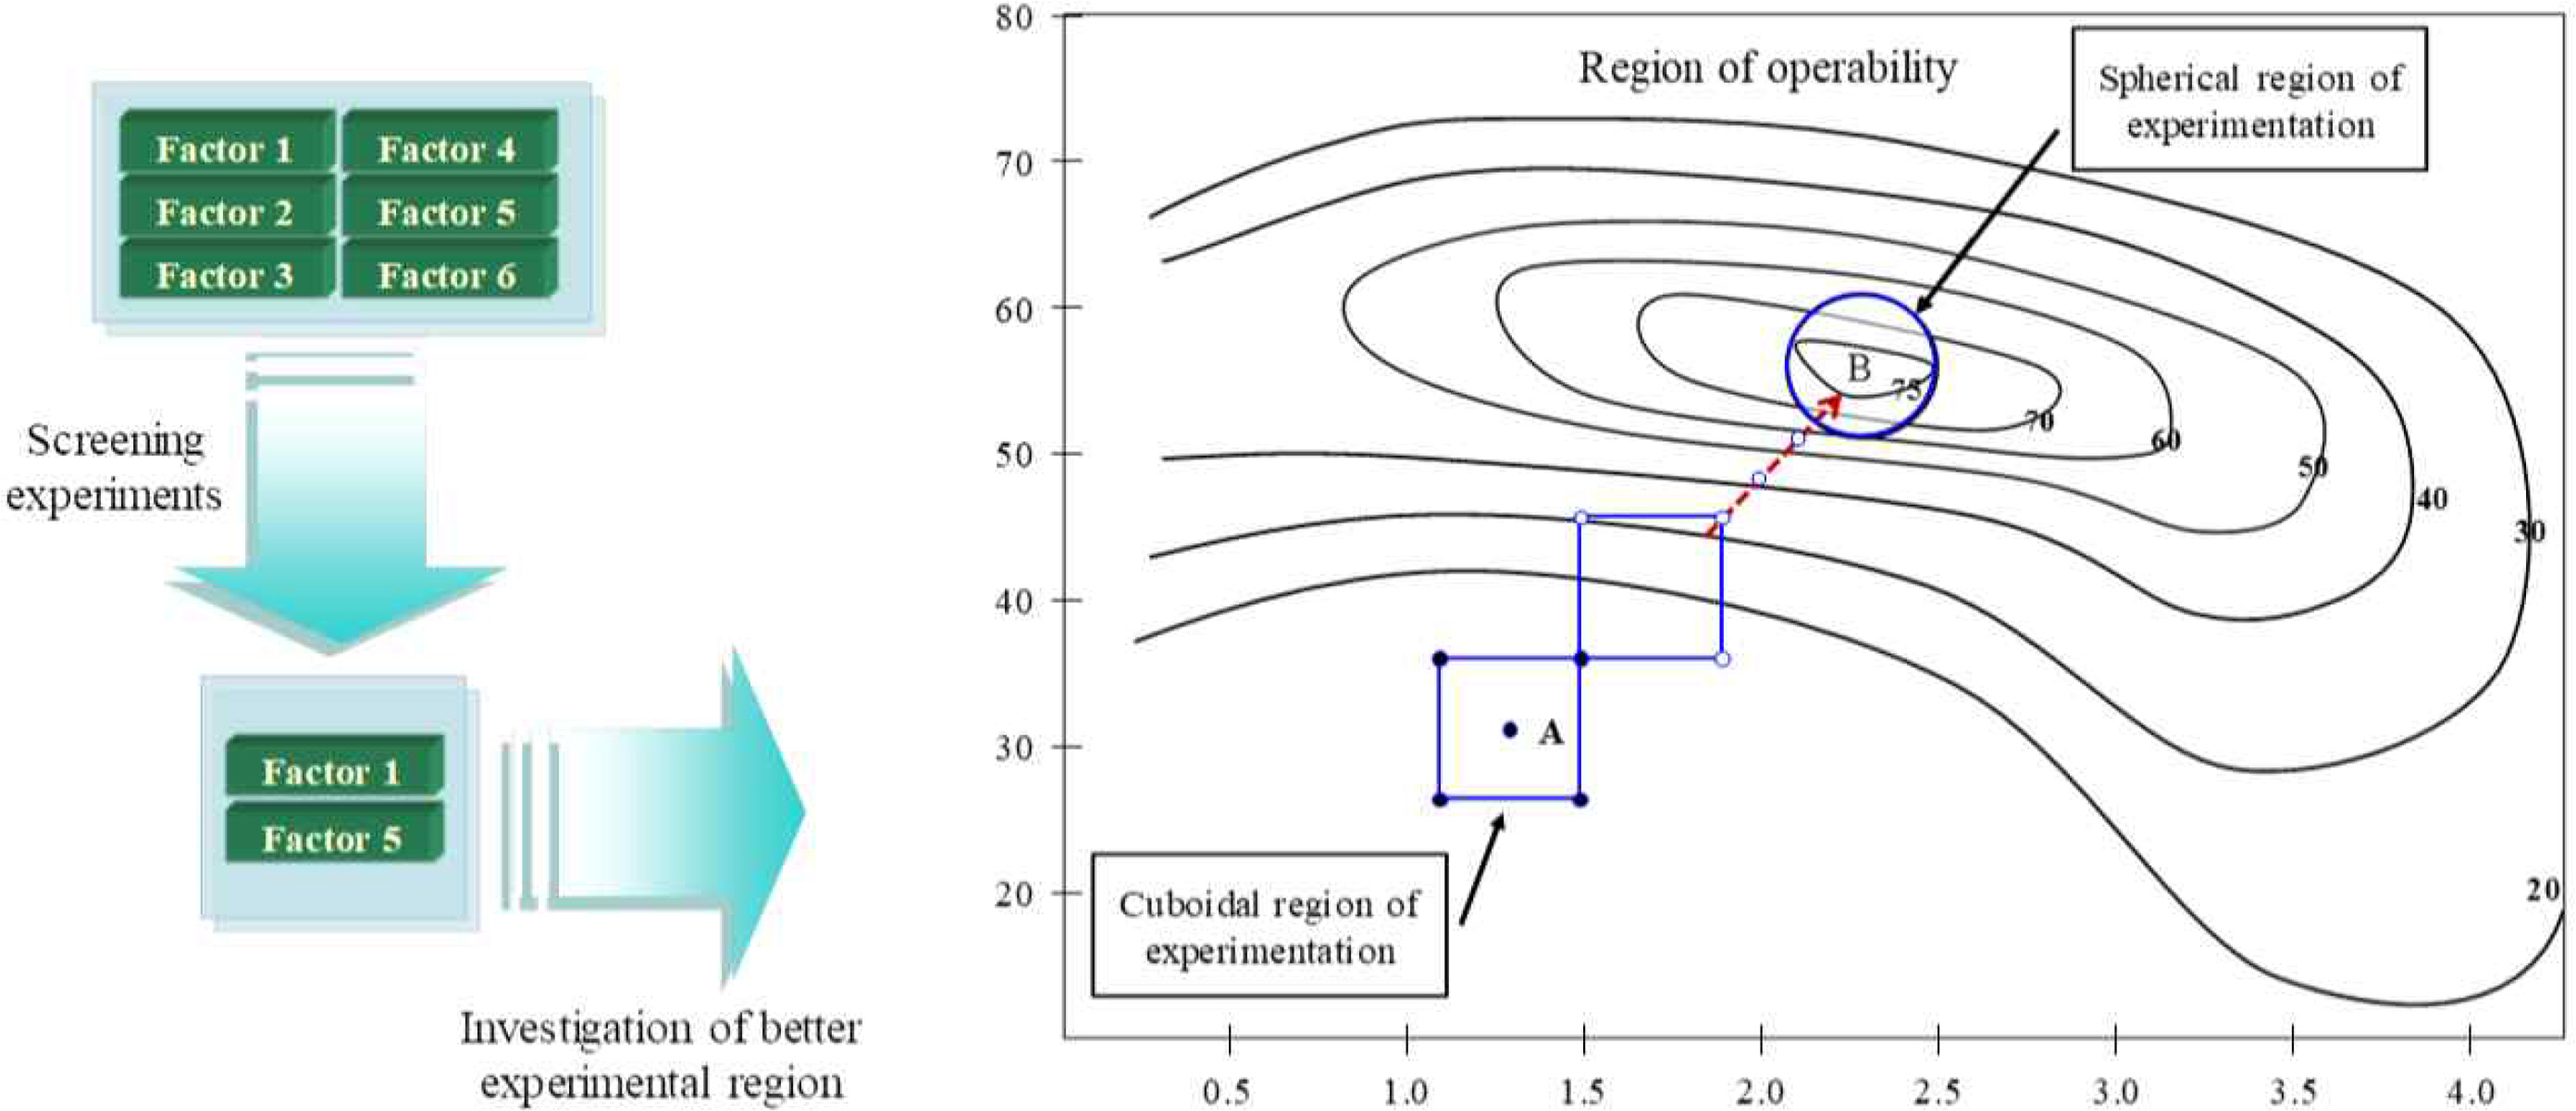
Sequential Nature of Response Surface Design
By systematically moving through the path of improvement, the sequential design points will be near the optimum point B. Since the true response surface around B usually shows a curvature, a second-order model can be employed to estimate the relationship between the response and factors. To estimate a second-order model, central composite design can be used, which is a combination of factorial points with center runs and axial points.
2.1 Steepest Ascent and Central Composite Design
Based on the result of the two-level factorial designs, the method of steepest ascent is used to search for a region of improved response by sequential movement from one region to another. <Figure 2> describes the sequential experimentation process. Consider the case of maximizing the response. If we assume that a first-order model is a reasonable approximation in the initial region of the factors composed of 2-level factorial points and center runs, the path of steepest ascent(PSA) is first computed so that one may expect the maximum increase in the response variable. Then we perform an experiment along the PSA until the response no longer improves. Next we perform another experiment with 2-level factorial points and center runs. If there is no curvature effect, another exploration along a new PSA is conducted. If a curvature effect is found, axial points are added with center runs to make a central composite design.
Asymmetric Composite Design (k=2)
CCD is the most popular way to estimate second-order models. During sequential experimentation, when a curvature effect exists, we need to add more experimental points to estimate quadratic terms in the model. Box and Wilson(1950) introduced the CCD, which is composed of two-level factorial design points with center runs and axial points.
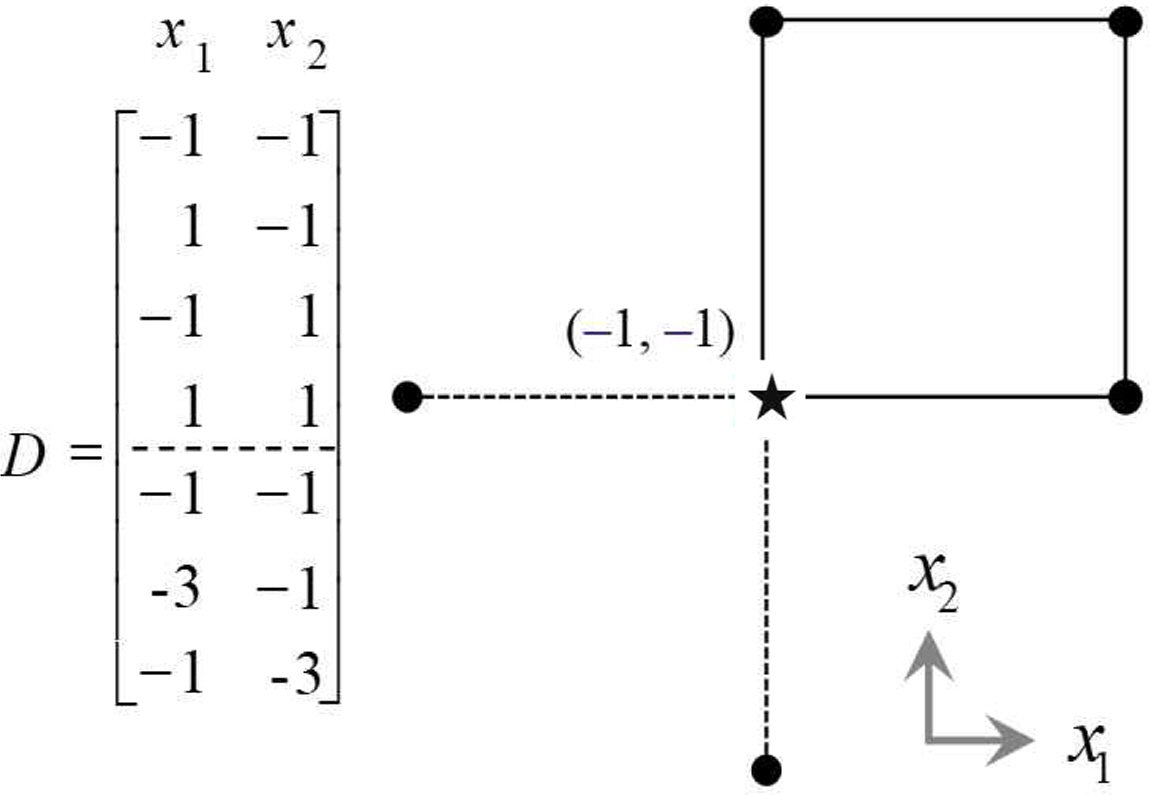
2.2 Asymmetric Composite Designs (ACD)
ACD is augmented with design points directed toward the best performing point ((★) in the initial 2-level factorial design. It does permit estimation of the second-order model in the fewest runs. ACD has the effect of shifting the center of gravity of the design closer to the center of the near-stationary region which we wish to study. <Figure 2> and <Figure 3> show the design matrices and experimental points for ACDs with two and three factors. In <Figure 2> the point (-1, -1) is best performing among the first four factorial points. So, the next two axial points to be explored are (-3, -1) and (-1, -3), which are stretched to the left and downward. <Figure 4> represents an example of design matrices for four and five factors.

Asymmetric Composite Design (k=3)
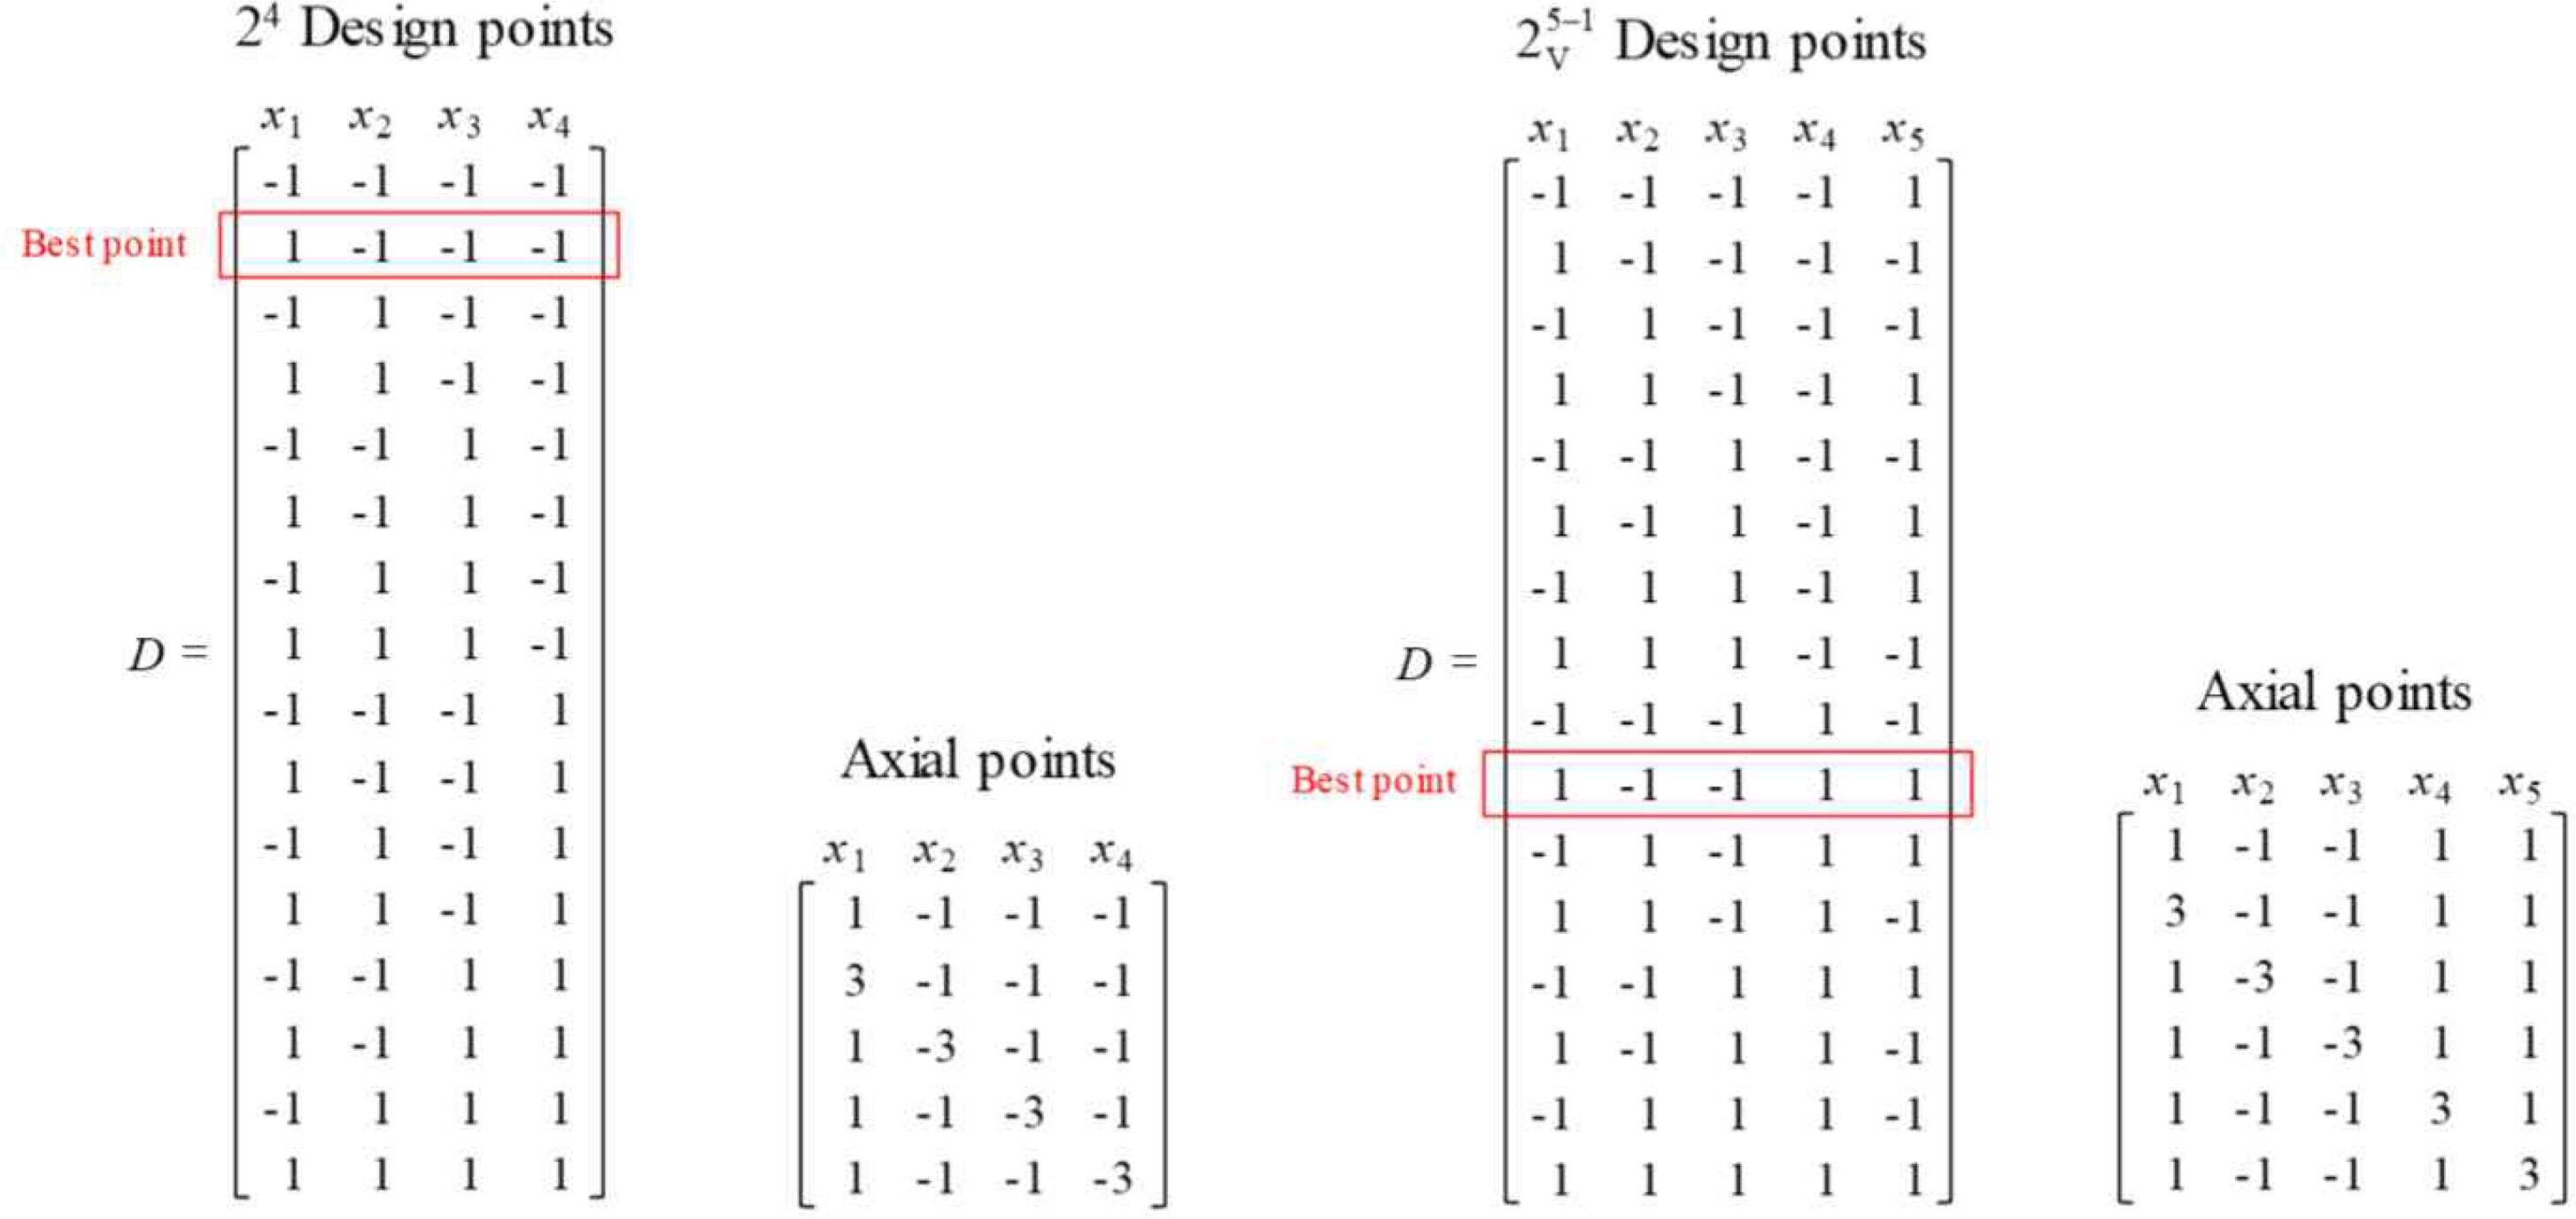
Asymmetric Composite Design Matrices (k=4, 5)
In <Figure 4>, since (1, -1, -1, -1) is the best point in the first factorial design, the next axial points lie in each axis to the direction of possible improvement. <Figure 5> is an illustration of axial points when the best point in the first factorial design is (1, -1, -1, 1, 1).
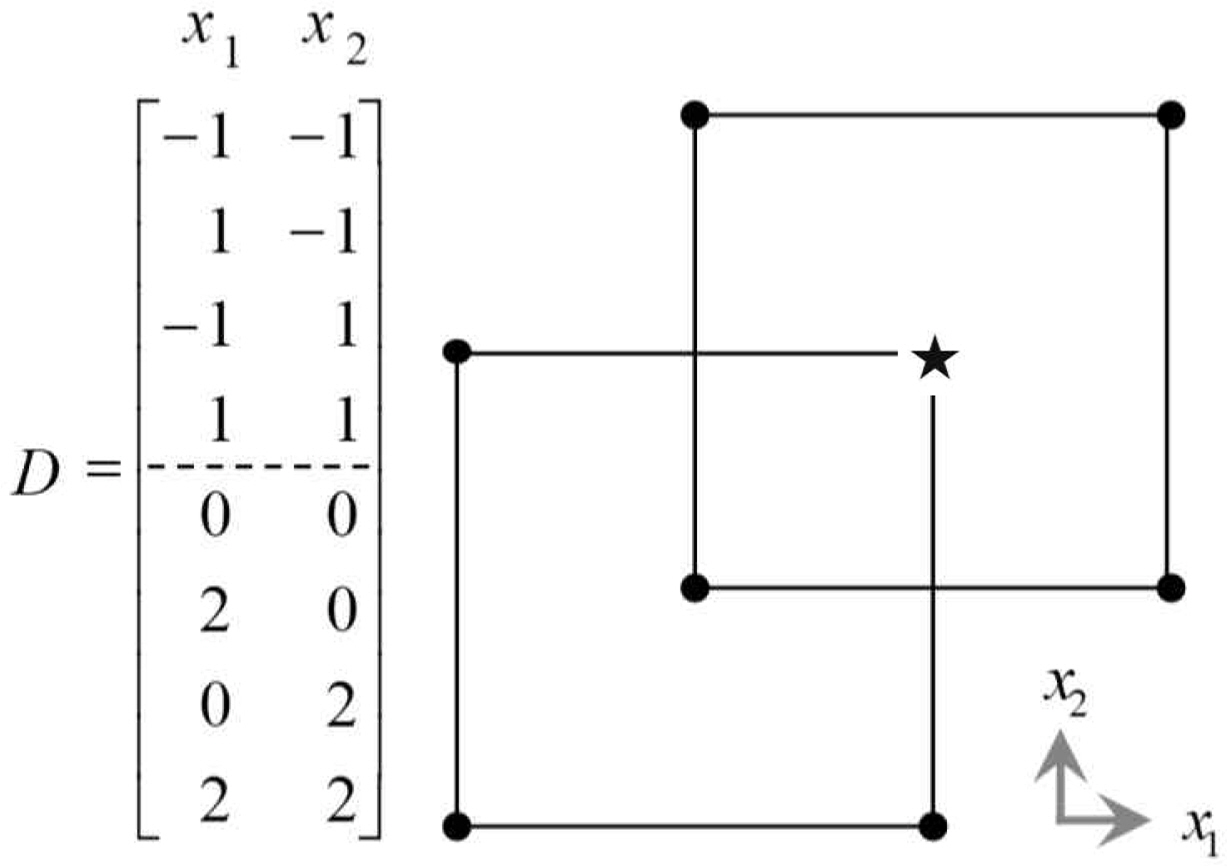
Overlapping Noncentral Composite Design (k=2)
2.3 Overlapping Noncentral Composite Designs (ONCD)
Based on the initial factorial design of two levels, Mee(2001) proposed a noncentral composite design in which the second factorial design is augmented to the initial (first) design with the shifted center. He recommends centering the second factorial design around one of the points from the first design block. Mee(2001) showed that by shifting the center of the second factorial design block to one of the points of the first factorial design, we can balance the combined design by retaining more design region overlap for the two blocks and achieving better precision for the quadratic estimates.
<Figure 5> and <Figure 6> show the design matrices and experimental points for ONCDs with two and three factors. In these figures, the directions of improvement are (1, 1) and (1, 1, 1), as denoted by a star sign. As can be seen in the figures, the overlaying portions between the first and second factorial designs are 25% and 12.5%, respectively.
Overlapping Noncentral Composite Design (k=3)
3. Non-overlapping Noncentral Composite Designs (NNCD)
3.1 Constructing NNCD
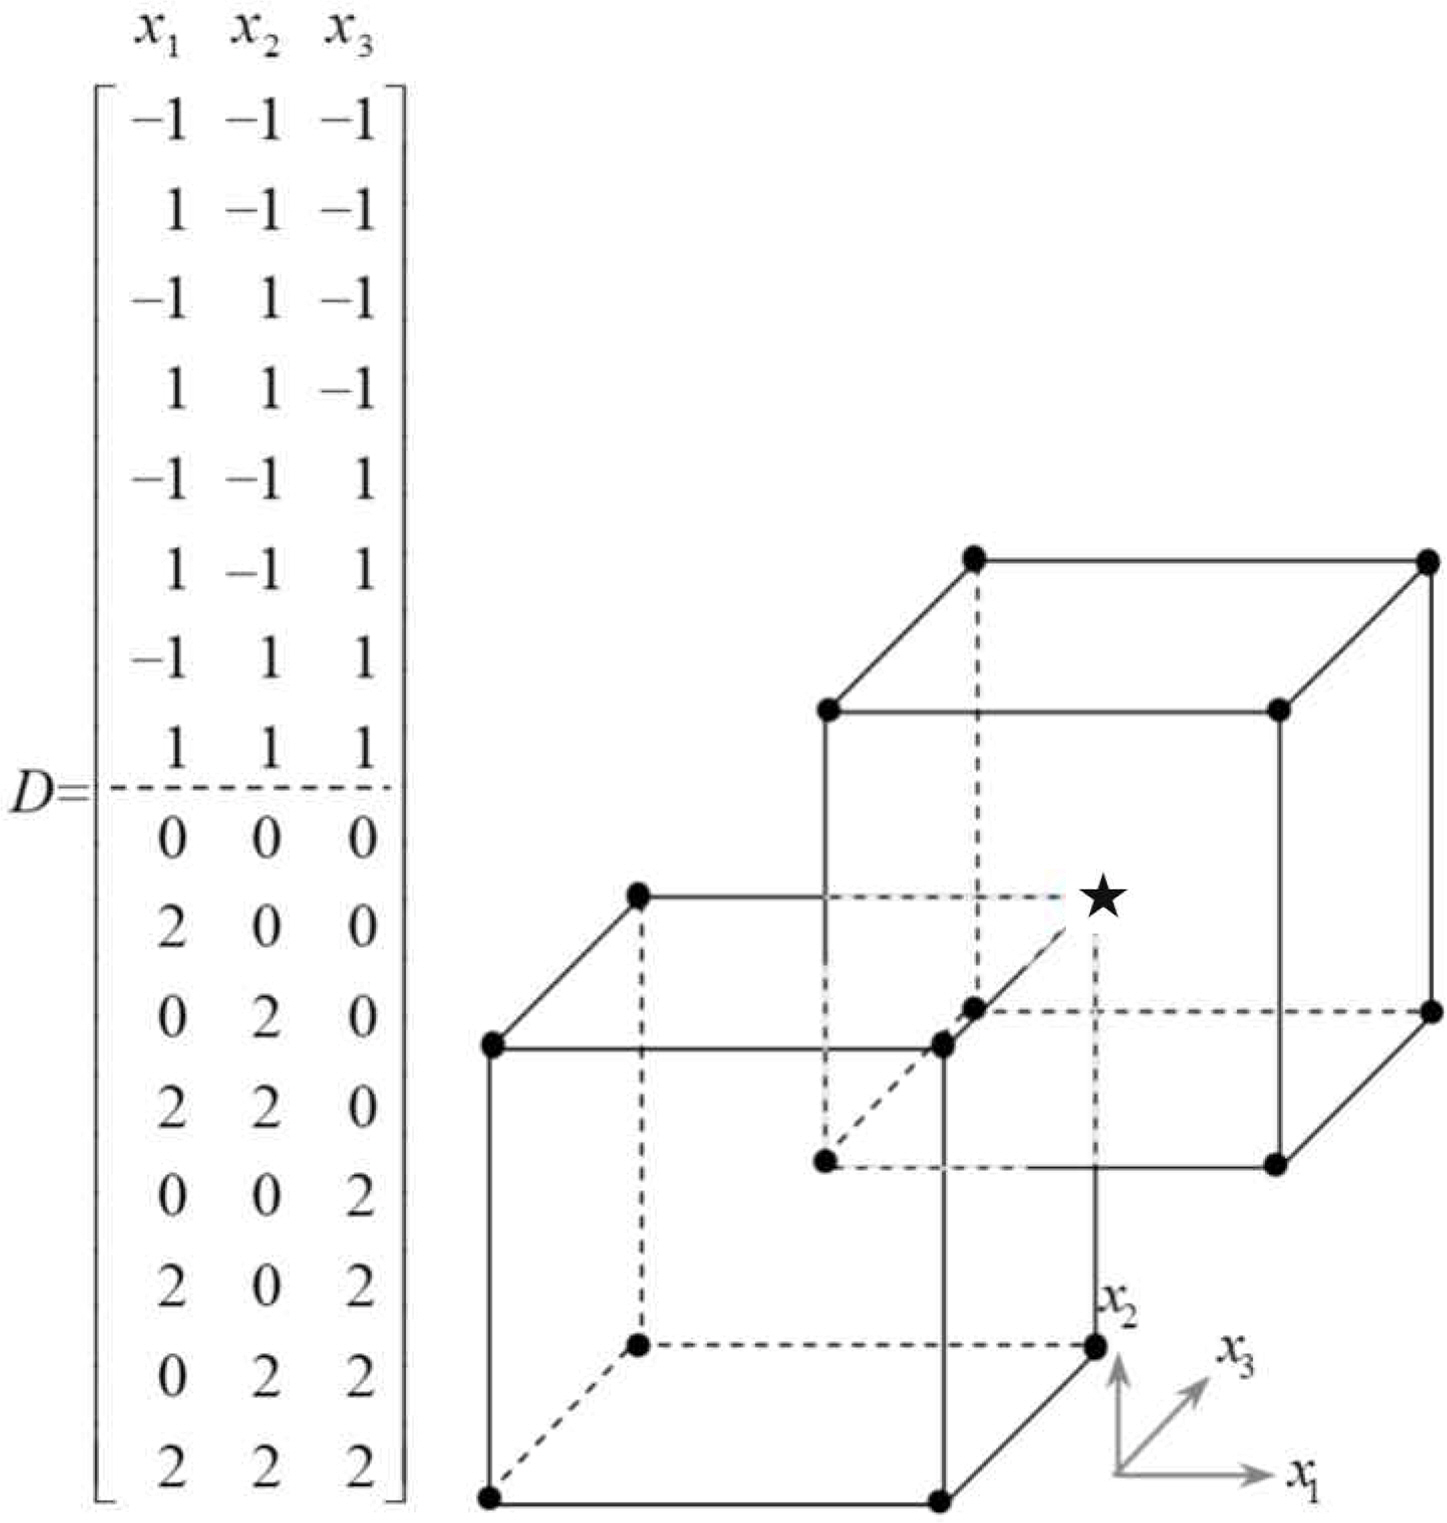
ONCD proposed by Mee (2001) are useful if the experimenter tries to explore the direction of improvement near the first factorial design region. What if it is the experimenter wants to explore farther away from the first design region? In this paper, a non-overlapping noncentral composite design (NNCD) is proposed. In NNCD, the second factorial design block shares one design point which indicates the best response value among the design points in the first factorial design block. <Figure 7> and <Figure 8> show the design matrices and experimental points of 2-factor and 3-factor NNCDs, respectively. NNCDs have another advantage of being able to check the block effect by comparing two runs from different designs at the same design point, such as (1, 1) in <Figure 7> and (1, 1, 1) in <Figure 8>.

Non-overlapping Noncentral Composite Designs (k=2)
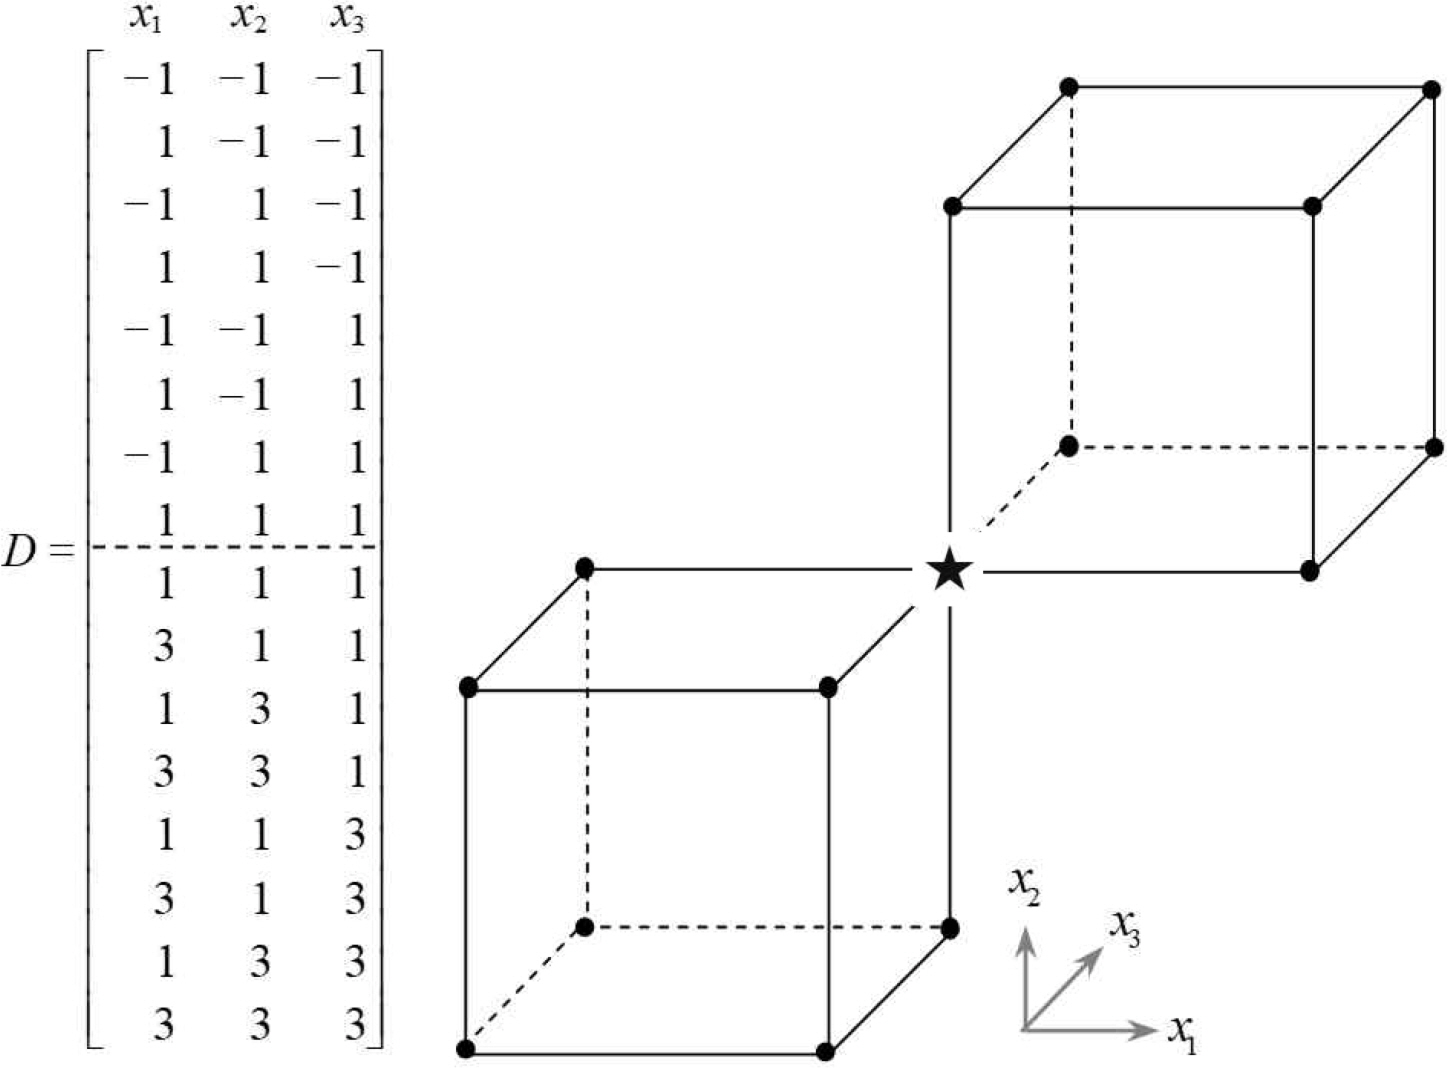
Non-overlapping Noncentral Composite Designs (k=3)
Model coefficients can be estimated by the regression analysis using the combined data from the first and the second factorial designs.
3.2 Illustration of the NNCD Implementation
The NNCD is illustrated when the response data y are obtained from the following second-order model:
The contour of the Equation is shown in <Figure 10>. The initial factorial design region is the rectangle of thick solid line defined by (-1, 1) for both x1 and x2 . From the response data, (1, 1) is the best among the four treatment combinations. If the experimenter employs the NNCD, the second design space will be represented by the solid line rectangle defined by (1, 3) for both x1 and x2. The first and second factorial designs share the star point (1, 1).
Scaled Prediction Variance of CCD, ACD, ONCD, NNCD (k=2)
On the contrary, if the ONCD is adopted, the design space and the response values will be presented as the dotted line rectangle defined by (0, 2) for both x1 and x2. in <Figure 9>. In this case, the star point (1, 1) will be the center of the second factorial design. From the <Figure 9>, it is understood that NNCD is better than ONCD when the optimal condition is located farther away from the first factorial design region.
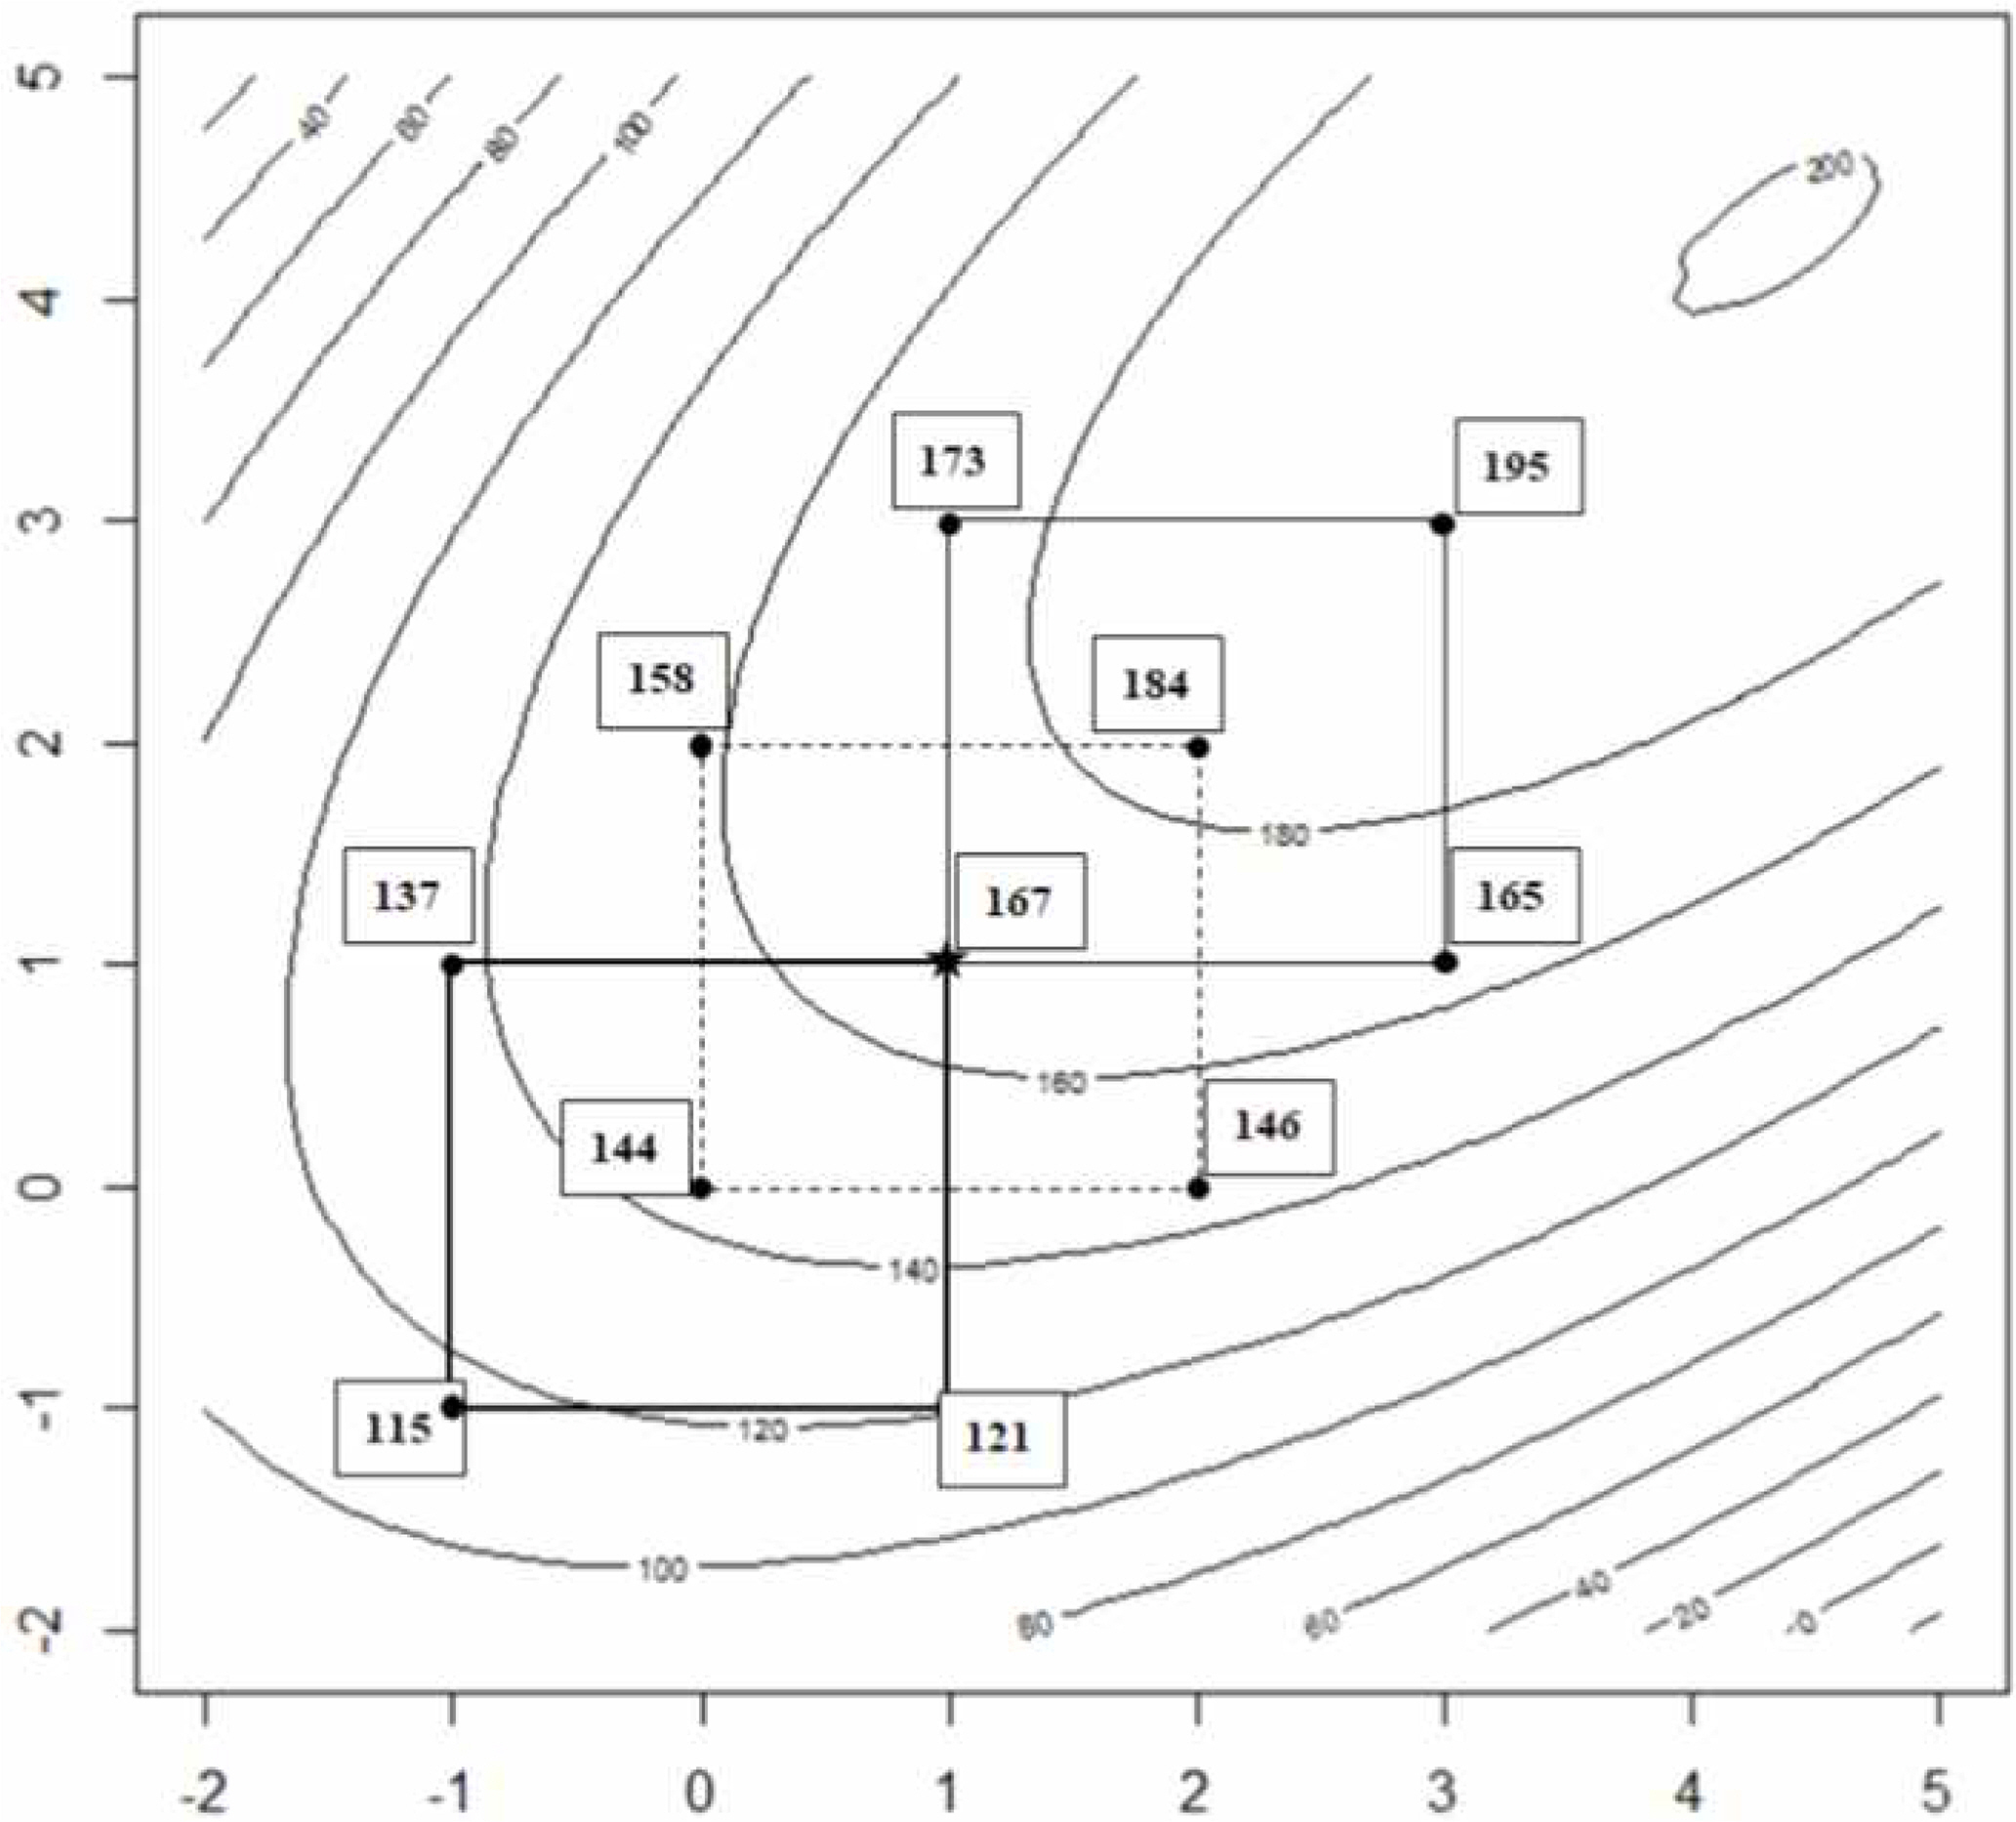
Contour plot, NNCD, and ONCD
4. Design Performance Evaluation
4.1 Evaluation Criteria
The composite designs - CCD, ACD, ONCD, and NNCD - are compared from the viewpoint of the four design evaluation criteria. D- and A-optimality are related to the parameter estimation capability, while Gand I-optimality are concerned with the prediction variance inside the region of experimentation.
Since the design regions are different, they are standardized and compared. D-optimality is related to the size of the determinant of the moment matrix M = X'X/N, where X is the effect matrix and N is the number of experimental runs. M-1 = N(X'X)-1, which is the dispersion matrix scaled by N/σ2, is the variance-covariance matrix of the estimated coefficients. An important norm on the moment matrix is the normalized determinant M = (|X'X|/Np)1/p, which is called the D1/p value, where p is the number of parameters in the model. Since |X'X| is inversely proportional to the square of the volume of the confidence region of the coefficients, a larger |X'X|, that is, smaller |X'X|-1, implies a better estimation of the regression coefficients in the model. D-efficiency is related to the D-optimality criterion as follows (Mee, 2009):
The concept of A-optimality is related to the individual variances of the regression coefficients. Unlike D-optimality, it does not make use of the covariances among coefficients, but only takes into account the variances of the regression coefficients which are in the diagonals of (X'X)-1. A-optimality is defined as minimizing tr(X'X)-1, where ‘tr’ represents trace, that is, the sum of the variances of the coefficients (weighted by N/σ2). A-efficiency is computed as follows (Mee, 2009):
The primary goal of many designed experiments is to allow for good prediction throughout the design space. G-optimality focuses on the maximum prediction variance. It seeks to protect against the worst case prediction variance, since when we use the results of our analysis we may wish to predict new response values anywhere in the design region. This measure is computed as (Myers, et. al., 2009):
In Eq. (3),
Another important design-optimality criterion that addresses prediction variance is I-optimality (Mee, 2009). The attempt here is to generate a single measure of prediction performance through an averaging process; that is, SPV is averaged over the region of interest R. The averaging is accomplished via the integration over R. The corresponding division by the volume of R produces an average performance:
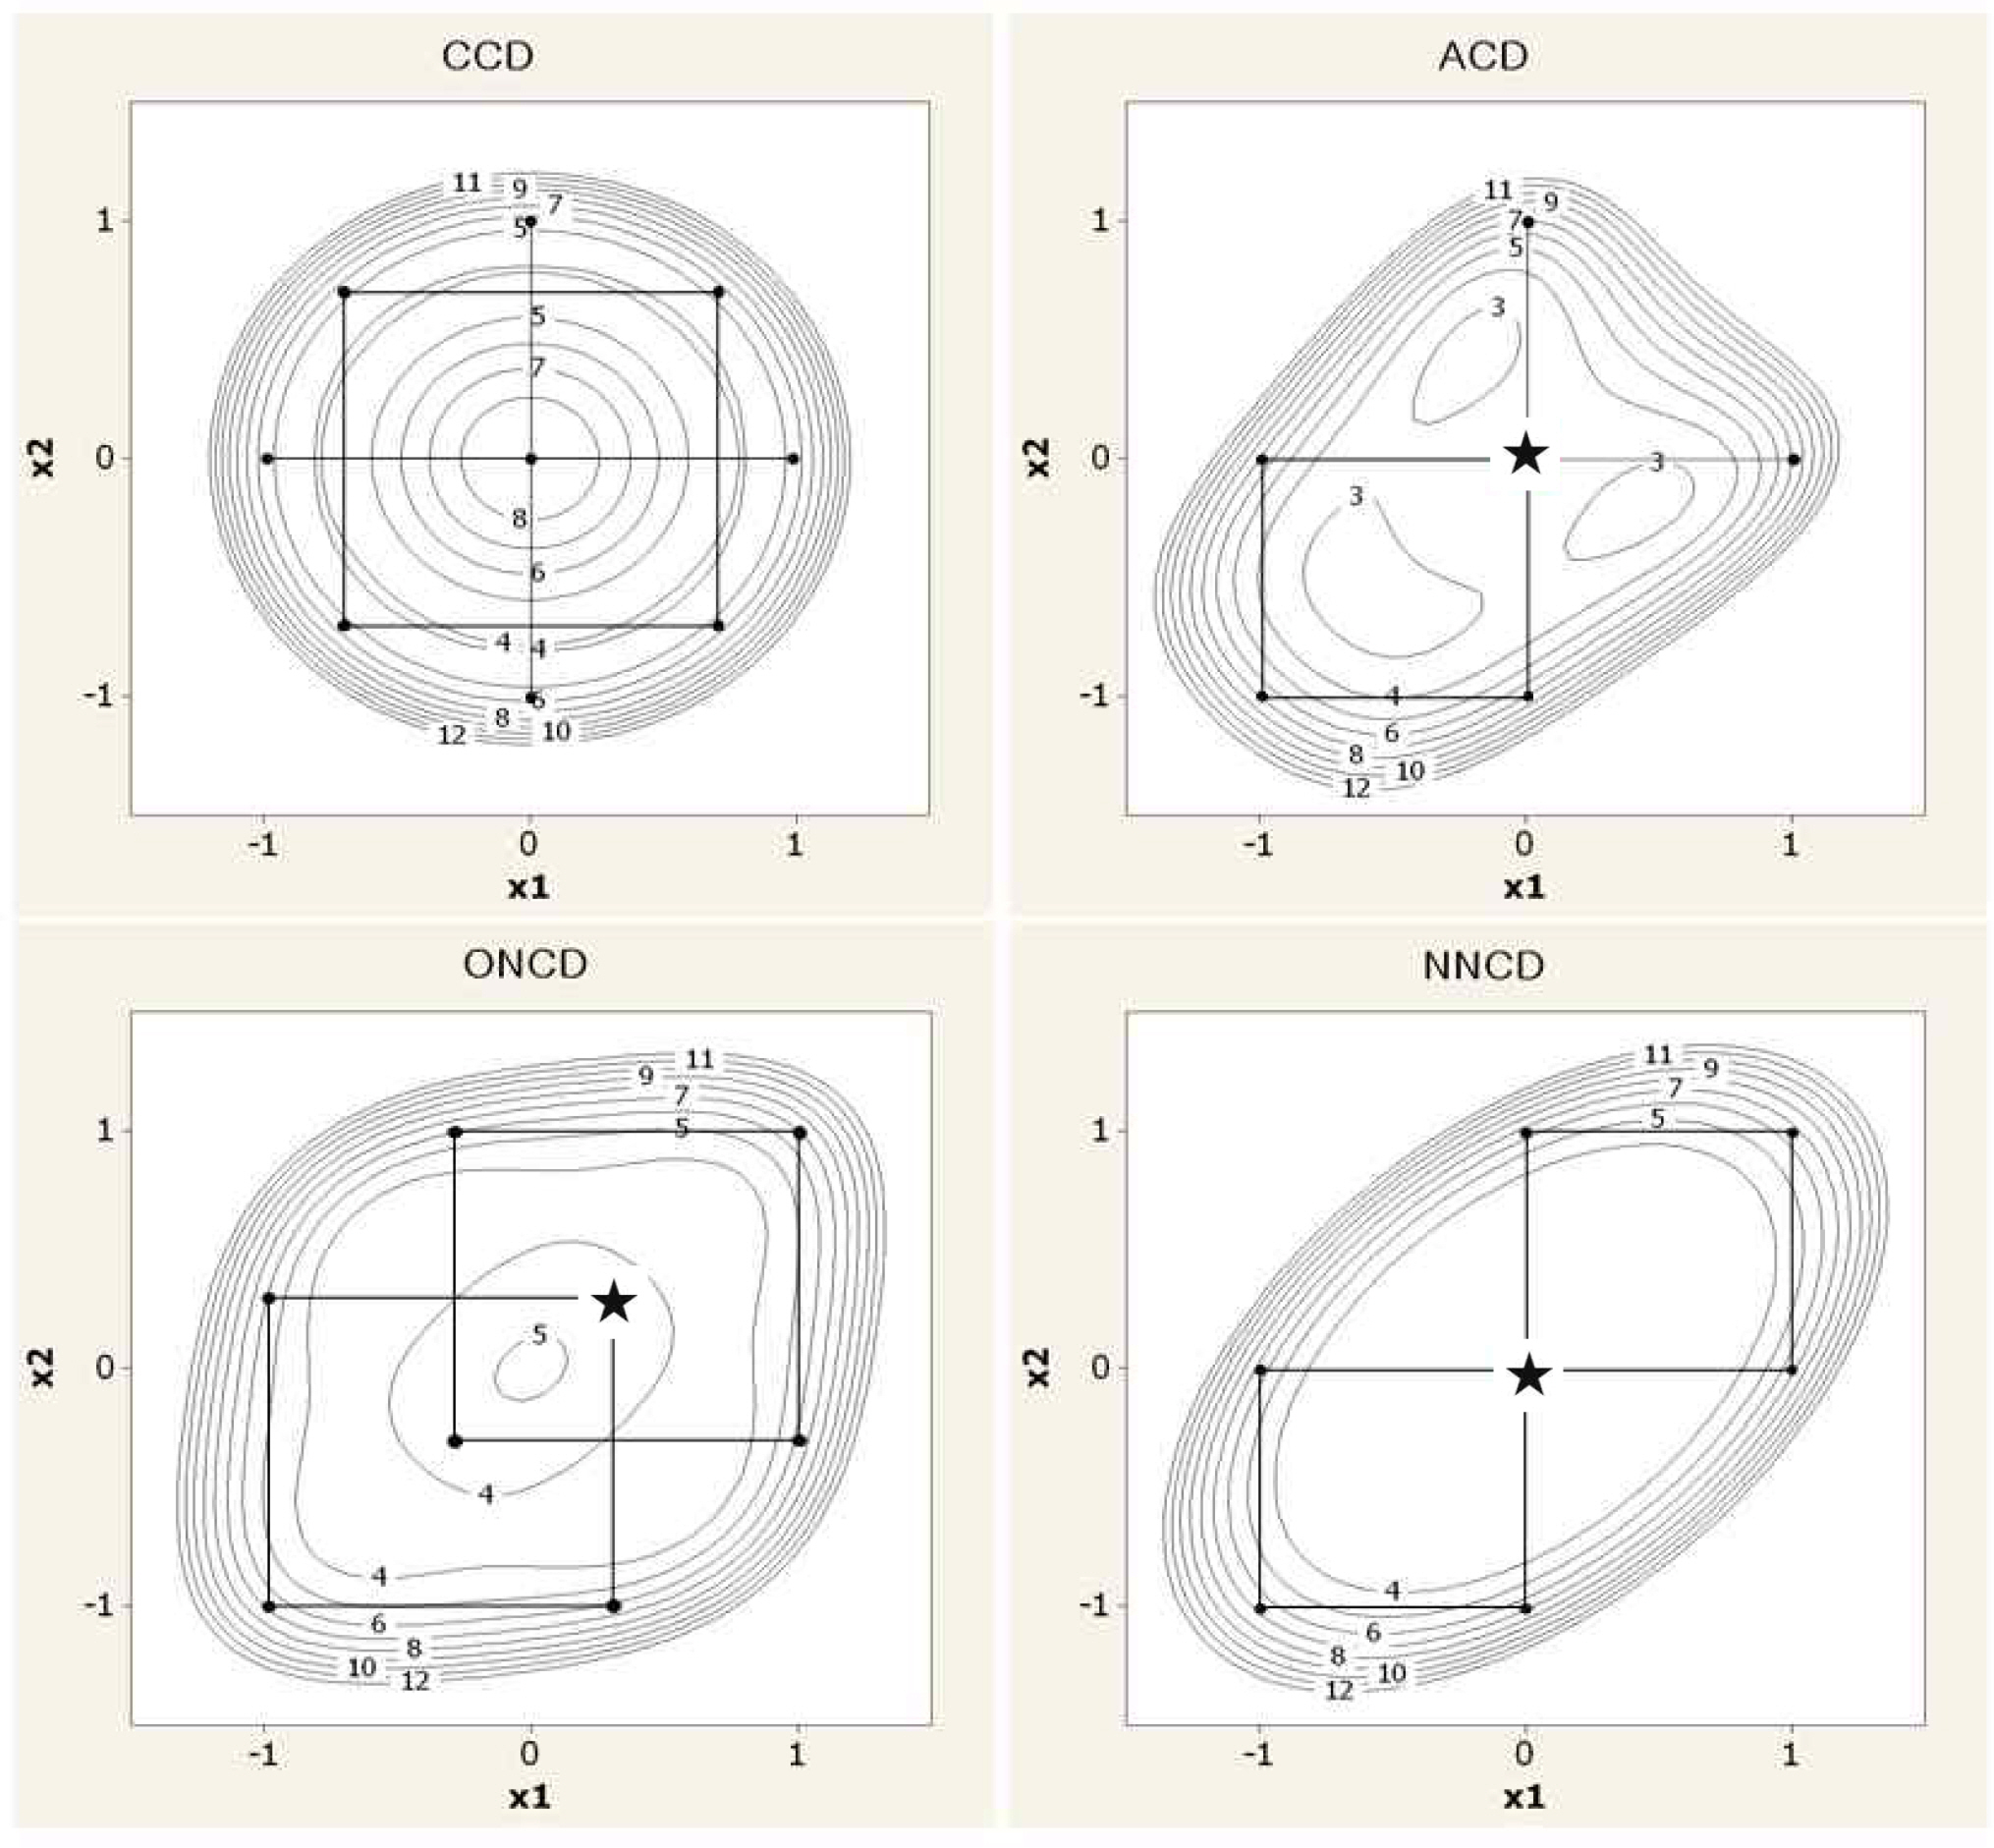
Contours of the scaled prediction variances of the 4 composite designs are presented in <Figure 10>. In <Figure 10>, CCD shows rotatability, and ACD and ONCD present more irregular prediction variance shapes.
4.2 Comparison of the Composite Designs
Four composite designs are compared in terms of the four optimality criteria mentioned in the subsection 4.1. Note that D-, A-, G-optimality criteria is larger-the-better, while I-optimality is smaller-the-better. To compare the designs with the design regions relatively as similar as possible, we make use of the coded unit in the design matrix. Lower level in the entire design is coded to -1, upper level +1. CCD with one center point run in the second block is considered. For CCD, the distance from the center to the axial points is set as (2k)1/4 to ensure rotatability. Comparison results are given in <Table 1> for k= 2, 3 and 4 factors. In each case we consider an initial factorial block with 2k factorial treatment combinations and nc= 0 or 1 center point(cp) runs. From the table, we can see that ONCD performs better than CCD, ACD and NNCD with respect to the optimality criteria for k=2. When k=3 or 4, NNCD is better than ONCD with respect to the I-optimality. In terms of follow-up runs, ACD is preferred when the number of factors is greater than three.

Design Performance Evaluation of CCD, ACD, ONCD, and NNCD
5. Follow-Up Design Strategy
Uses and advantages of the follow-up designs are summarized in the <Table 2>, which can be a basis for the sequential design strategy for follow-up experiments from the analysis result of the first factorial design experimental data.
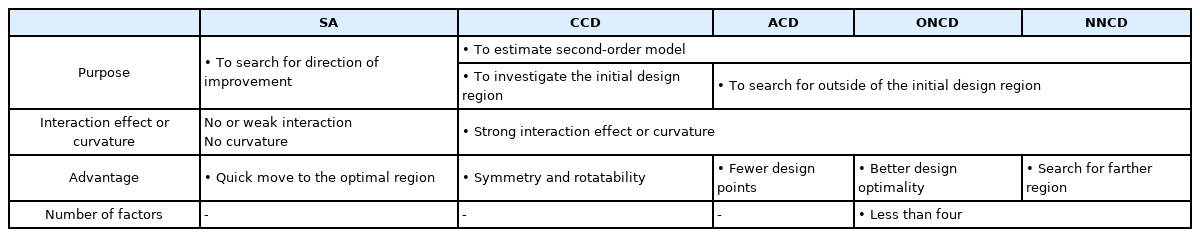
Summary of Designs for Sequential Experimentation
Based on the results of this study, follow-up design strategy is presented by a flow diagram in <Figure 11> and <Figure 12>. Phase I addresses experimenting along the direction of steepest ascent until there is no further improvement in the response. At that point, a new factorial experiment with center runs is conducted to determine a new search direction. This process is repeated until a significant curvature in response surface is detected. When significant curvature is detected, the experimenter should proceed to Phase Ⅱ.

Flow Diagram for Sequential Experimentation Strategy (Phase I)

Flow Diagram for Sequential Experimentation Strategy (Phase II)
Phase Ⅱ is employed to estimate the curvature of the response surface and ultimately to find the optimum conditions. When the number of factors is less than 4, it is better to adopt ONCD since it shows excellent performance in terms of the various evaluation criteria. However, if the current experimental if the experimenter wants to explore farther region in the direction of improvement, NNCD can be employed. When the number of factors to be considered is 4 or more and the optimum is out of the current design region, it is suggested to use ACD to reduce the number of experimental points.
6. Concluding Remarks
Sequential experimentation strategy is considered to explore the direction of improvement if a large interaction effect is found from the data analysis of the first factorial design block. Non-overlapping noncentral composite design(NNCD) is proposed to explore farther in the region of improvement. For NNCD, the second factorial design is augmented to the first factorial design sharing one design point, which allows opportunity to check if there is a difference between the two blocks. Moreover, four composite designs for sequential experimentation, that is, composite design(CCD), asymmetric composite design(ACD), overlapping noncentral composite design(ONCD), and non-overlapping noncentral composite design(NNCD), are illustrated with graphical representation and design matrices. The performances of the four composite designs are compared in terms the number of design points and the design optimality criteria. Lastly, we summarize a sequential experimentation strategy for the practitioners.