Effects of Instructor's Communication Quality on Learning Flow and Satisfaction of Students: Targeting the Students(Parents) Participating in the Early Childhood Education Programs
Article information
Abstract
Purpose:
This study surveyed the effects of instructors’ verbal and nonverbal communication quality on students’ learning flow and satisfaction. We divided the two types of communication into sub-factors — verbal communication into language, and nonverbal communication into kinesics, proxemics, paralanguage and physical appearance — to examine the causal relationship between learning flow and learning satisfaction.
Methods:
This study was conducted on the students (parents) of a paid early childhood education program run by “I” company located in Seoul, from November 12, 2014 to November 18, 2014. A total of 317 (90.5%, effective) questionnaires were collected and analyzed using SPSS 18.0 and AMOS 18.0.
Results:
First, the verbal communication of the lecturers was found to have significantly positive (+) effects on learning satisfaction. Second, among the nonverbal communications, proxemics and physical appearance were found to have positive (+) effects on learning flow. Third, among the nonverbal communications, proxemics was found to have positive (+) effects on learning satisfaction. Fourth, the learning flow of students was found to have positive (+) effects on learning satisfaction. Conclusion: This study’s findings can contribute to realizing desirable communication between instructors and students.
1. Introduction
Communication has been studied in several dimensions, from the message exchange process and message per se, to its interpretation and effects on behavior (Littlejohn and Foss, 2010). Communication can be divided into interpersonal and mass communication, with the latter attracting more attention in the research field (Jeon, 2013). Such low research interest on interpersonal communication, an important capacity for daily lives or tasks, seems partially due to a particular research culture. That is, communication is an integrated field in which human experience, psychology and behavior all play a role, and there are different communication methods and language specific to a particular field, both of which are thwarting research efforts.
However, humans are social beings bound to live in association with one another, which all the more accentuates the significance of interpersonal communications. Communication is the key to achieving smooth and effective collaboration and to developing and maintaining close relationships. Because its failure begets many social conflicts, learning effective communication skills is imperative for one’s growth and accomplishment as well as an amicable and harmonious relationship. Given these points, research on interpersonal communications also holds high academical significance.
Interpersonal communication also accounts for a significant portion in education. This is because self-directed learning only occurs after a bidirectional communication is established between the student and instructor. When students far outnumber instructors, it is difficult for instructors to provide enough attention to a single student, rendering communication more difficult. However, a system in which students rate their instructors presents a good opportunity for the instructors to acquire an objective assessment of their communication, which can compel them to strive for a better communication quality. It would be beneficial for the students as well, as an improvement of communication quality would increase their engagement and satisfaction in the class.
Most of the previous Korean studies on interpersonal communication have categorized communication into verbal and nonverbal communication. Of those that studied verbal communication, Kim (2005) suggested that verbal communication can exert a significant effect on customers’ positive and negative emotions while Kim and Yu (2008) stressed the importance of verbal communication in forming and maintaining mutuality with customers. Other studies contended that the nonverbal communication skills of hospitality employees (hotels and restaurants) and golf coaches have positive effects on consumers’ trust (Jung and Yoon, 2010; Choi and Nam, 2012; Park, Kang, and Lee, 2012), and that of physical instructors and service instructors also have positive effects on learning flow (Choi, 2011; Lee and Park, 2012). In addition, students’ trust for the instructor has been found to wield positive influence on students’ satisfaction and learning flow (Jeon, Lee, and Lee, 2010; Yu and Park, 2011; Gu, 2012).
Nevertheless, it can be seen that existing researches on interpersonal communication leaned toward surveying customer-contact employees while concentrating on lecturer’s communication styles and types with regard to students’ satisfaction and learning flow. Hence, this study examined the communication of instructors working at a culture center owned by “I” company located in Seoul. Then we classified the communications into verbal and nonverbal communication, in an attempt to empirically verify the effects of such communication on students (parents) who have taken a paid early childhood education program. To this end, we established the following research questions. First, how do the instructors’ verbal and nonverbal communications affect students’ learning flow? Second, how do the instructors’ verbal and nonverbal communications affect students’ learning satisfaction? We expect this study’s findings to contribute to realizing desirable communication between instructors and students, and also to be used as useful preliminary data for further research on effective education.
2. Theoretical Background
2.1 Communication
Communication is defined as an exchange of thoughts and feelings between individuals via spoken or written words, sounds, facial expressions and body motions; it is the base of all social organizations and phenomena involving humans (Choi, Jung, and Lee, 2010). Moreover, communication also holds connotations of “common” or “shared,” and it is translated as an “exchange of ideas or thoughts” in Korean. Seo (2002) integrated multiple definitions of communication and suggested that communication is a “process via which meaningful information is transmitted.” According to Seo, communication is a process through which two or more parties send ideas and emotions and receive responses from one another via verbal or nonverbal means, ultimately facilitating mutual interaction. As noted here, communication can be classified into verbal or nonverbal aspects.
2.1.1 Verbal Communication
Somerville (1982) suggested that language is a socially instituted system of symbols that constitutes the most fundamental means of communication; Somerville contended that the essence of language is “transmission and expression of meaning,” and that language is at the core of human communication. Because humans express themselves, sense, think, and determine behaviors all through language, verbal communication is an important building block of interpersonal relationships. Verbal communication has been studied not only in the field of communication but also in that of education, service and marketing, and are recognized as critical factors in forming and maintaining mutual interpersonal relationships (Kim, 2008).
2.1.2 Nonverbal Communication
Delmont (1991) asserted that nonverbal actions not only reinforce verbal communication, but also function as important means of expressing oneself, shedding light on the significance of their communicative function. Nonverbal communication refers to the facial expressions, gaze, body motions, physical appearance, and speech (Burgoon, Birk, and Pfau, 1990).
Mentioning that a significant portion of the information gained from human communication is acquired via nonverbal methods, Randall (1974) pointed out that nonverbal messages are indispensable to communication. This is because nonverbal communication is of the unconscious mind, through whose process one’s internal states and emotional responses are nakedly exposed. Nonverbal communication transmits social meaning such as one’s interest and intimacy (Burgoon, 1991) and sparks and maintains human relationships. The components of nonverbal communication are delineated below.
First, kinesics. Kinesics includes facial expressions and communicative motions via eye movement and contact, gestures, and postures (Argyle, 1994). Second, proxemics. This is related to the relationship between communication and space, noting the minimum required space for comfortable communication as well as the proximity in which parties begin feeling uncomfortable. Third, paralanguage. This does not involve an actual conversation; it is a collection of various sounds people make during a conversation (Trager, 1958), including voice qualities (e.g., pitch range, lip control, rhythm control and tempo), vocal character (e.g., laughing, crying, and yawning), sounds expressing agreement, satisfaction, contempt, or disbelief (e.g., “uh-huh,” “ah-hah,” and “hmm”) and short pauses. Fourth, physical appearance, referring to one’s physical characters such as attractiveness and outfits. It is an important nonverbal component in interpersonal communication, as people by and large show propensity of judging others by their looks.
2.2 Learning Flow
Studies on “flow” began with the attempts to identify the psychological phenomenon of people being immersed in a particular subject or activity. Several scholars surveyed flow in a number of fields, including work, leisure activities, education and sports. They defined flow as a profoundly pleasant mental state — a feeling of total “immersion” in something (Csikszentmihalyi, 1975). Csikszentmihalyi (1997) describe flow as a holistic emotion or feeling aroused by a completely absorbed state where one is focused on one thing, responding only to a clear goal and feedback and experiencing a sense of control over the surrounding environment. As a result, he contends, one loses any cognitive or perceptual processes irrelevant to the current area of focus.
Similarly, learning flow refers to the state in which one loses track of time or consciousness due to a full absorption in learning, demonstrating one’s full potential (Lee and Ji, 2013). Learning flow grants students enjoyment during the learning process and compels them to actively participate, thereby offering more satisfaction and sense of accomplishment. Moreover, learning flow can also shorten learning time.
With regard to this study, we can predict that instructors having a higher quality of verbal and nonverbal communication would intensify students’ learning flow.
2.3 Learning Satisfaction
Learning satisfaction means the degree to which learning needs are satisfied, that is, the degree to which requisite learning contents are provided (Kim and Chung, 1997). In other words, it can be understood as an individual’s subjective responses (e.g., attitudes, perception, emotion, behavior, and will) to a program based on the individual’s experience with the education provided via the program.
With regard to learning satisfaction, Levy (2007) confirmed that the group exhibiting higher satisfaction in education were more likely to continue education than the group showing less satisfaction, arguing that learning satisfaction plays a considerable role in continuing education. Martinez and Munday (1998) mentioned satisfaction in educational quality, timetable, and learning environment is a key factor — along with support from educational institutions—associated with continuing education. MüMller (2008) maintained that when students are satisfied with the instructor’s instructing competence and interaction, they are more willing to take additional classes and continue education even after completing the course. Therefore, we predict that the instructor’s verbal and nonverbal communication quality would be important boosting factors for learning satisfaction.
3. Research Design
3.1 Research Model
This study verified the effects of instructors’ verbal and nonverbal communication quality on students’ learning flow and learning satisfaction. To this end, we reviewed existing studies and based on the analyses divided verbal communication (language) and nonverbal communication (kinesics, proxemics, paralanguage, and physical appearance) into their corresponding sub-factors to examine the causal relationship between learning flow and learning satisfaction. Based on the previously mentioned grounds, we can predict that verbal and nonverbal communication would affect learning flow and learning satisfaction. Furthermore, learning flow would also have a significant effect on learning satisfaction. With the presumption that instructors’ verbal and nonverbal communication would significantly affect students’ learning flow and satisfaction, this study established the following study model.
3.2 Establishing Research Hypotheses
3.2.1 Relationship Between Instructors’ Communication Quality and Students’ Learning Flow
Instructor’s communication can ameliorate students’ engagement in class. Lee and Lee (2010) accentuated the role of nonverbal communication in effective and strategical instruction, stating that an instructor’s use of nonverbal communication enhances students’ understanding of class material, facilitates student-instructor relationship, and increases student engagement. It has also been found that physical education instructors’ nonverbal communicative capacity positively affects students’ engagement (Lee and Park, 2012); furthermore, service instructors’ verbal and nonverbal communication quality has been found to exert a direct influence on students’ engagement (Choi, 2011). Thus, we established the following hypotheses.
Hypothesis 1 : The instructor’s communication quality will have a significant positive effect on students’ learning flow.
Hypothesis 1-1 : Language will have a significant positive effect on learning flow.
Hypothesis 1-2 : Kinesics will have a significant positive effect on learning flow.
Hypothesis 1-3 : Proxemics will have a significant positive effect on learning flow.
Hypothesis 1-4 : Paralanguage will have a significant positive effect on learning flow.
Hypothesis 1-5 : Physical appearance will have a significant positive effect on learning flow.
3.2.2 Relationship Between Instructors’ Communication Quality and Student’s Learning Satisfaction
Previous studies have found that when an instructor displays communication behaviors perceived highly by the students, the students gain more satisfaction in the class and instructor, and educational effectiveness escalates (Goodboy and Myers, 2008). Moreover, students who were willing to talk to their instructors for various reasons showed higher satisfaction in the class (Goodboy and Martin, 2007). Similarly, actively asking questions during class and visiting instructors for additional support after class also were found to enhance students’ satisfaction (Martin et al., 2011). In addition, a study on the communication of lifelong educators confirmed that high communication quality tends to boost educational effectiveness and satisfaction (Kim, 2007).
Summarizing the given points, we can argue that an instructor equipped with high communicative capacity can increase students’ satisfaction (Spitzberg, 1991), subsequently wielding a considerable effect on learning effects and overall class rating (Goodboy, Martin, and Bolkan, 2009). Therefore, based on these grounds, we established the following hypotheses.
Hypothesis 2 : The instructor’s communication quality will have a significant positive effect on students’ learning satisfaction.
Hypothesis 2-1 : Language will have a significant positive effect on learning satisfaction.
Hypothesis 2-2 : Kinesics will have a significant positive effect on learning satisfaction.
Hypothesis 2-3 : Proxemics will have a significant positive effect on learning satisfaction.
Hypothesis 2-4 : Paralanguage will have a significant positive effect on learning satisfaction.
Hypothesis 2-5 : Physical appearance will have a significant positive effect on learning satisfaction.
3.2.3 Relationship Between Students’ Learning Flow and Learning Satisfaction
Many studies have verified that students with higher learning flow have greater overall satisfaction with learning and school. Rossin et al. (2009) conducted a study on business graduate school students and found that experience of learning flow is a predictor of learning outcomes, including satisfaction in school’s support. Clarke and Haworth (1994) carried out a questionnaire survey on undergraduates with a hypothesis stating that experiencing learning flow would bring more benefits than a simple enjoyment, and that it would be a good predictor of overall student satisfaction. Their findings confirmed this hypothesis; students with better learning flow exhibited higher satisfaction. Several other studies have also confirmed that learning flow is a critical factor in achieving learning satisfaction (Kim, 2007; Kim, 2009). Meanwhile, there are much research interest in satisfaction and organizational commitment in the corporate context as well. By analyzing the relationship between organizational commitment and job satisfaction of 425 service workers via structural equation modeling, Testa (2001) reported that organizational commitment has a significant effect on job satisfaction. Summarizing these points, we established the following hypotheses.
Hypothesis 3 : Students’ learning flow will have a significant positive effect on learning satisfaction.
3.3 Questionnaire Items and Measurement Methods
3.3.1 Communication Quality
In this study, we categorized communication into the verbal and nonverbal communications. Verbal communication was based on the findings of Kim’s (2007) study, and nonverbal communication was based on that of Bonoma and Felder’s (1977) study. The measurement items used in this study were originally used in the studies of Erickson et al. (1978), Dodd(1982), and Burgoon et al. (1990), and their reliability and validity were verified by Kim (2007). We modified and complemented these 19 items for the appropriate use of this study.
3.3.2 Learning Flow
Through learning flow, students can develop their ego, expand their capacity, and acquire positive attitudes toward learning. We chose 5 items to measure learning flow whose reliability and validity were verified by Joo, Kim, and Choi (2009) based on Kim’s (2009) study. These items were modified and complemented to fit the purpose of this study.
3.3.3 Learning Satisfaction
Higher learning satisfaction can further facilitate understanding and participation in learning, ultimately forming a positive self-worth. To measure learning satisfaction, we used 7 items first developed by Shin (2003) and whose reliability (reliability coefficient >.9) and validity were verified by Joo et al. (2009). These items were modified and complemented to fit the purpose of this study.
4. Empirical Analysis
4.1 Data Collection and Analyses Methods
This study was conducted on the students (parents) of a paid early childhood education program run by “I” company located in Seoul. The questionnaires were collected over 1 week from November 12, 2014 to November 18, 2014. A total of 350 questionnaires were distributed, and 317 (90.5 %, effective) were collected. The questionnaire comprised a total of 31 items, with two dimensions of communication quality and items regarding students’ learning flow and learning satisfaction.
The collected data were analyzed using SPSS 18.0 and AMOS 18.0. We performed a frequency test on SPSS 18.0 to identify the demographic characteristics of the samples. We also performed reliability and validity tests based on the factor analysis results. Using the AMOS 18.0, we conducted the structural equation model to verify the causal relationship between the constructs proposed in the research model.
4.2 Questionnaire Construction
The questionnaire items were broadly categorized into communication quality, learning flow and learning satisfaction, all of which were further divided into more detailed items. These items are illustrated in Table 1.

Questionnaire Items
4.3 Sample Characteristics
As shown in Table 2, all 317 subjects (100.0 %) were female. Most of them (73.2) were in their 30s, and 57.7% of the subjects had college degrees. Seoul residents accounted for 66.2% of all subjects, followed by Geonggi (22.1%), Choongnam (9.8%), Incheon (0.9%) and Gangwon (0.9%).

Demographic Characteristics
4.4 Reliability and Validity of the Measurement Items
An exploratory factor analysis was performed to verify the validity of the questionnaire items. Varimax rotation, the most commonly used factor rotation method, was used to simplify the factors, and double-loaded items as well as items with factor values of less than 0.50 were excluded. Cronbach's ɑ was calculated to measure reliability. The exploratory factor analysis revealed 5 factors for the independent variable and 2 factors for the dependent variable. The factors showed high reliability, with Cronbach’s ɑ coefficients of 0.8 or greater. The analysis results are illustrated in Table 3 and Table 4.

Factor and Reliability Analysis of the Independent Variables

Factor and reliability analysis of the dependent variables
4.5 Confirmatory Factor Analysis
The confirmatory factor analysis was conducted in order to derive a measurement model for the measurement items by metric unit. In order to evaluate the goodness-of-fit for an optimum state of the configuration of the items for each step, χ², GFI, AGFI, RMR, NFI and others were used. The results of the confirmatory factor analysis are delineated in Table 5 and Table 6. The structural model consisting of independent variables such as the fit indices (χ²=432.254, df=113, p=0.000, RMR=0.018, GFI=0.889, NFI=0.814, IFI=0.949, CFI=0.948) and the fit indices of the structural model consisting of dependent variables (χ²=184.607, df=37, p=0.000, RMR=0.019, GFI=0.921, NFI=0.950, IFI=0.960, CFI=0.959) were acceptable. In addition, all construct scales were found to have sufficient convergent validity with statistically significant t-values for the factor loadings.

Confirmatory Factor Analysis Results (Communication Quality)
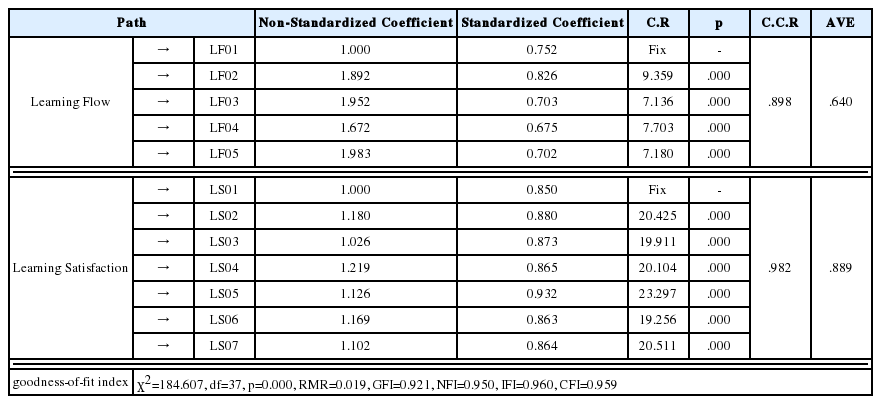
Confirmatory Factor Analysis Results (Learning Flow, Learning Satisfaction)
We conducted a correlation analysis using the Pearson correlation coefficient. The results are illustrated in Table 7. Two variables with a correlation coefficient of greater than 0.8 can be deemed identical and can result in multi collinearity. However, the correlation coefficients of this study’s variables were all less than 0.8, confirming a valid discriminant validity.
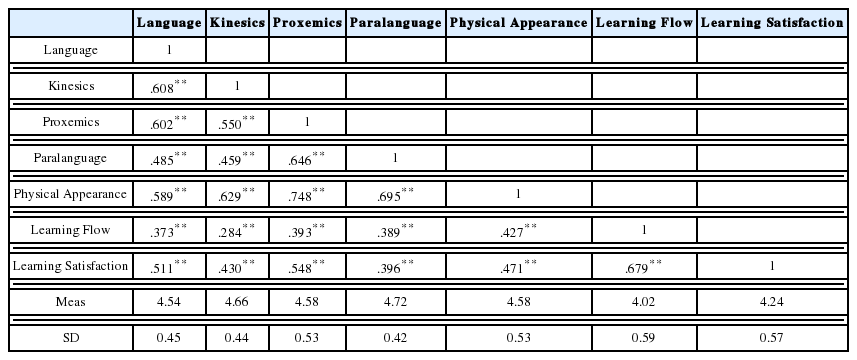
Correlation Coefficients
4.6 Goodness-of-fit of the Research Model
To test the research model, we performed a path analysis using the AMOS 18.0. The goodness-of-fit statistic and indices were equal to that of a saturated model, all favorably fitting the data with χ²=1464.915, df=314, p=0.000, RMR=0.023, GFI=0.802, NFI=0.868, IFI=0.893, and CFI=0.892. After testing the hypotheses regarding the interrelations of communication language, kinesics, proxemics, paralanguage, physical appearance, learning flow, and learning satisfaction, out of 11 hypotheses, 7 were accepted and 4 were rejected at a significance level of 0.10. Hypothesis testing results are shown in Table 8.
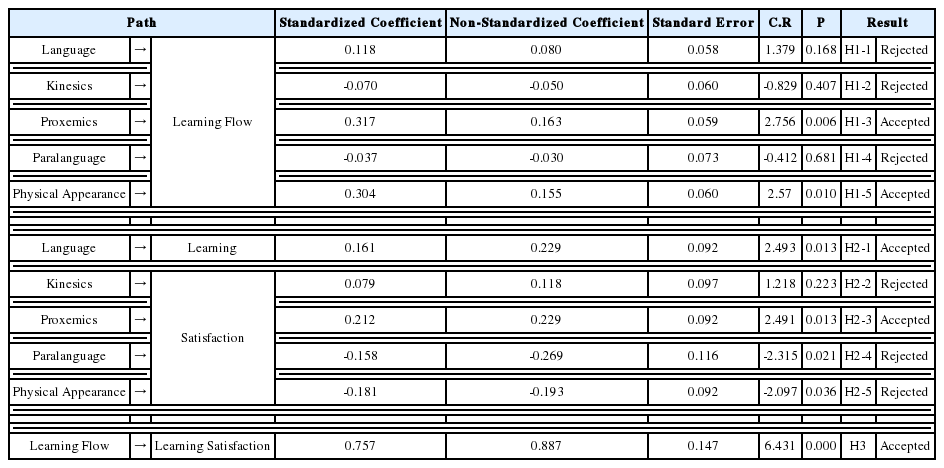
Results of Hypothesis Testing on Inter-Variable Relationships
5. Conclusion
This study sought to offer constructive implications by probing how an instructor’s communication quality affects the students’ learning flow and satisfaction. Theoretical implications are as follows.
First, the instructors’ verbal communication had a significant positive effect on learning satisfaction, which supports the results of studies of Choi (2011). This indicates that the basic demands for an instructor — greetings, explanation of activities or materials, easy and appropriate answers to students’ questions, and clear and concise expressions — help students to adapt to the class environment and induce active participation in class. In addition, the more active the class participation is, the more they can appreciate the joys and values of the classes, which leads to the increase on overall satisfaction. These outcomes, in turn, beget enjoyment in class and values of education, ultimately enhancing students’ satisfaction.
Second, the instructors’ proxemics and physical appearance (sub-factors of nonverbal communication) had a significant positive effect on learning flow, which supports the results of studies of Lee and Park (2012). Such results demonstrate that the efforts of instructors in delivering the messages in a comfortable and clear manner ameliorate students’ concentration and aid their performance in class. In addition, the attractive appearance of the instructor is interpreted as they may appeal as favorable impression and credibility of the instructor to students. This is in line with the commonly known fact that beauty prompts hospitality, fondness, and sociability in others. Finally, an instructor’s attractive looks provoke positive (favorable) emotions in the student, leading to a more enjoyable class ambience and better learning flow.
Third, among the nonverbal communications, proxemics was found to have significantly positive (+) effects on learning satisfaction and supports the findings on the researches of Kim (2007). It was also found that the appropriate proxemics that the teacher has with students in class has direct effects on learning satisfaction. Therefore, the accessability between a teacher and students will need the appropriate spatial perception considering the spatial distance and noise etc. due to the limited classroom space.
Fourth, students’ learning flow had a significant positive effect on learning satisfaction, supporting the findings of Kim (2007) and Kim (2009). This illustrates that effective verbal expressions, affability and comfort-generating nonverbal behaviors significantly affect learning flow, which in turn provoke active participation on the students’ part and enhance class quality, generating high satisfaction. In other words, verbal and nonverbal communicative capacities are indispensable qualities that every instructor should strive to achieve.
In the light of these results, we suggest the following practical implications.
First, an instructor should reacknowledge the importance of verbal communication. With this in mind, an instructor should endeavor to deliver precise and succinct expressions and display sufficient attention to the students by using effective verbal language to induce favorable responses from them.
Second, although an instructor’s nonverbal communication is not an actual expression of words or a conversation, it indeed impacts students’ flow and satisfaction. Hence, an instructor should utilize effective body and facial expressions and gestures, and always strive to pinpoint the most appropriate communication method in every class.
Third, a natural and effective verbal and nonverbal communication is conveyed only when they are “embedded” in the instructor’s daily communication skills. Instructors can achieve this through vigorous monitoring and training, which calls for systematic training programs that can equip them with effective communication skills.
Despite these valuable implications, this study still has a few limitations.
First, the type of program and subjects studied were limited. This study’s subjects comprised parents with young children, and it would be beneficial for future studies to select a more diverse educational program and subjects. Second, instructors’ communication should be examined under the context of a service provider. That is to say, instructors are, in a sense, service providers — providing education programs to customers — in a culture center environment. Moreover, as a business, a culture center should approach their products (education programs, which feature lifelong education-like structures) with a focus on the business significance and profitability. With this in mind, future studies should probe profitable factors that can better performance.
Research Model