


1. Introduction
Industrial and socioeconomic landscapes have been changing to adopt the convergence of manufacturing, service, and IT sectors. The 4th industrial revolution is beginning to reshape all sectors ranging from service to manufacturing. Amid the change, what one can find is how traditional sectors would be converted under the new changes including the 4th revolution. Not all traditional sectors will successfully survive. In comparison, some sectors will find a momentum for growth. One of the typical areas of interests reflecting the change, called i-fashion, has been developing in the textile, fashion, apparel, and related IT services. The history of this change should be examined in depth for different disciplines owing to their own strengths. However, this research while reviewing the development toward it attempts to identify a potential developmental pattern by analyzing industrial convergence by time seriesbased clustering of related industries. The finding of this study is that this convergence trend will continue to deepen as the fourth industrial revolution era is entered [1,2].
2. Literature Review
2.1 Precedents for Industry 4.0
2.1.1 History of Convergence
Because of largescale installment of factories, fulfilling Adam Smith’s theory of industrial revolution, capitalism has gained a new drive for growth [3–5]. The typical factors determining the growth in mainstream economics have been labor and capital, represented by L and K, respectively. These factors act sometimes independently, but in many cases synergistically, for enhancing productivity and other economic and financial indicators in capitalism [6,8]. The synergetic action of the two factors is an alternative presentation of the role of technology in capitalism and its development. Based on this mechanism, capitalism entered the second and third industrial revolutions; in the former as the introduction of largescale facilities, and in the latter as information revolution [7]. Following from the history, the fourth revolution has provided insight on the area where technology will bring capitalism into the future, which has been clearly the tradition of convergence [8].
Prior to discussing the topic of convergence, which can be described as the indication of i-fashion, it is relevant to understand the importance of the technology factor. One critical nature of capitalism in understanding its economic growth dynamics is that markets can become saturated [9–11]. If markets are saturated, then it is difficult to achieve economic growth. For this urgent problem, one solution is to rely on population growth for economic development, and the other alternative for resolving market saturation is “technology” [16]. Technology can create new markets [15]. This is highlighted to show that there exist both demand and supply sides of technology.
The supply side of technology corresponds to people requiring a certain functionality and there being a specific technology fitting into that need. In comparison, the supply side of technology indicates that once a new technology emerges, typically people will find new approaches of using it. For example, i-fashion-related technology did not begin from nothing. Instead, there has been a series of intervals between the demand and supply sides of technology issues [11,12].
2.1.2 Preceding Trends Prior to Industry 4.0 and i-Fashion Trend
Since the first industrial revolution, for a long time, the economy and the industry have been following the legacy of the economies of scale, which has been the basis for almost every discussion and practice for industrial investment. [6,15] The trend toward the economies of scale was stimulated after World War 2. Moreover, the recovery of Germany and Japan after the war as well as the building of the strong industrial base of the U.S. are all potentially explainable by the theory of the economies of scale [17].
However, with industrial and economic development, there has been an inevitable trend emphasizing on the quality of production instead of on the volume in the economies of scale worldwide [13,14,17]. This trend has a historical origin, originating particularly from European industrial and institutional settings. It is named as flexible specialization [15, 18], providing strong insights about mass production. The remaining argument from this theory originated not only from its attractiveness as an alternative for mass production but also from mass production becoming the industrial norm based on political reasons [16,18]. The term of flexible specialization has its reference point in European institutions and history because the corresponding theory attempts to explain the trends in the textile and apparel industrial sectors in Italy and France. The attractiveness of the theory is that it shows how specialtybased industrial sectors, including textile and apparel sectors, have survived for hundreds of years with mass production system as the norm. When a mass production system fails, it is mostly believed that there is little chance for craft sectors to persist, including specialty apparel and textile sectors.
Although the economies of scale worldwide seem to dominate the industrial and economic development, this approach has a very serious drawback in its logic in the continuously increasing size of the market [17]. It has become clear since the 1970s and the 1980s that economies of scale hypothesisbased investment may not be effective for major industrial sectors, particularly during recession. New approaches have been developed to save mass production during recession to increase flexibility components. Now the game has been reversed. In the industrial history since the 1980s when the flexible specialization theory was established, mass production systems started to survive in the market by increasing their flexibility. Just-in-time production is a good example found in [19]. From the perspective of the decision makers, whether from the government or industries, motivated by the flexibility they focus on an “industrial district,” where the flexible technology and institutional settings are setup [20–22].
2.2. New Trends
2.2.1. IT-based Convergence
Presently, in addition to the search for agileness as well as flexibility, the third and fourth industrial revolutions based on information technology have changed the scene as a game changer by offering a clear and nonmarket saturating solution to industrial sectors, including i-fashion sector [22]. One inimitable trend has been that information technologybased third revolution has changed the structure of industries, boosting the productivity of other sectors. This relation has clearly opened a pathway for the fourth industrial revolution to reform various industrial sectors, including i-fashion sectors.
2.2.2 General trend of convergence
The second trend worth mentioning is the natural trend of technology development, which has been driving different hightechnology sectors to move in a similar direction. For example, the precision machinery manufacturing sector and the medical equipment sector can share many potential areas in their development. Similarly, the convergence of the industrial sectors can be evidenced and is only limited by preconceived stereotypes. This potential convergence, if proved empirically, can be used to explain the convergence of different industrial sectors toward i-fashion.
3. Data and Methodology
3.1 Data
To achieve the research objective to determine the convergence of industrial sectors, this research utilized the statistical database of Bank of Korea for obtaining sectoral level industry productivity data. This was done to obtain relatively compact yet precise results for estimating the industrial landscapes of the industrial sectors related with the i-fashion trend. For the Bank of Korea data of the average capital investment efficiency by industrial sectors, the average efficiency of machinery investment by the sectors between 2009 and 2019 was used. The industrial sectors included in the dataset of this research ranged from manufacturing to service and from high-tech to low-tech sectors. The sectors cover from textile and apparel to medical equipment, auto, and service sectors (such as personal service, wholesale, hotel, and education services). Instead of using raw data, this study attempted to capture the moving dynamics of industrial convergence. Consequently, this research utilized the annual change rates of both average capital investment efficiency and average efficiency of machinery investment by the sectors [23].
3.2 Methodology
The industrial data of Bank of Korea were analyzed to address the research questions, and the average capital efficiency and the average efficiency of machinery investment by industrial sector between 2009 and 2019 were first calculated. Subsequently, the research calculated the annual rate of change of both indicators to determine the implications for the industrial convergence of the sectors.
The rate of change of the average capital efficiency and the rate of change of the average efficiency of machinery investment were plotted. Following this, a time series databased clustering scheme was adopted to understand and corroborate how different sectors approach potential convergence toward i-fashion [24,25]. Although traditional cluster analysis is conducted mainly with crosssection data, recently, numerous studies are utilizing times series data-based applications, which are useful for tracking the changing patterns in datasets. Thus, this research employs the application feature of tie series-based clustering for understanding the dynamics toward i-fashion.
Procedures for Time-series based cluster analysis can be presented as follows.
Based on the calculated annual change rates, this research launched a numerical taxonomy with time-series based cluster analysis. The reason to be called as numerical taxonomy comes from the traits that change pattern of industrial sectors would determine which sectors will be grouped in separate groups [24,25].
Numerical expressions for the time series tuned cluster analysis can be presented as follows.
Stage 1: Average Rates
Begin with an N × T matrix R of average rates(or comparable performance variable) for N officially-defined industries for years t=0 to T . (3 digit SIC codes are typically used.)
Stage 2: Convert to Time Series Data
Convert to an N ×(T - T)=N × P matrix G whose elements git are the rates of change of the performance variable for i=T to N industries for years i=T to T . Each row g is therefore a time-series of rates of change.
Stage 3: Clustering Method
Cluster the rows of G according to the Euclidean distance D = ( Σ t ( g i t - g j t ) 2
Step 4: Grouping
Choose an appropriate level of grouping based on the agglomeration schedule and marginal loss of information as clustering progresses. That is, stop clustering at K groups when the algorithm starts forcing dissimilar objects into awkward and unwieldy clusters.
This research presents how plotting of the rate of change of the average capital efficiency and the rate of change of the average efficiency of machinery investment and conducting time series-based clustering of the machinery investment efficiency can mutually confirm the potential convergence phenomenon toward i-fashion.
4. Research Findings from Plotting of Three Indicators
4.1. Machinery Investment Efficiency vs. Capital Investment Efficiency
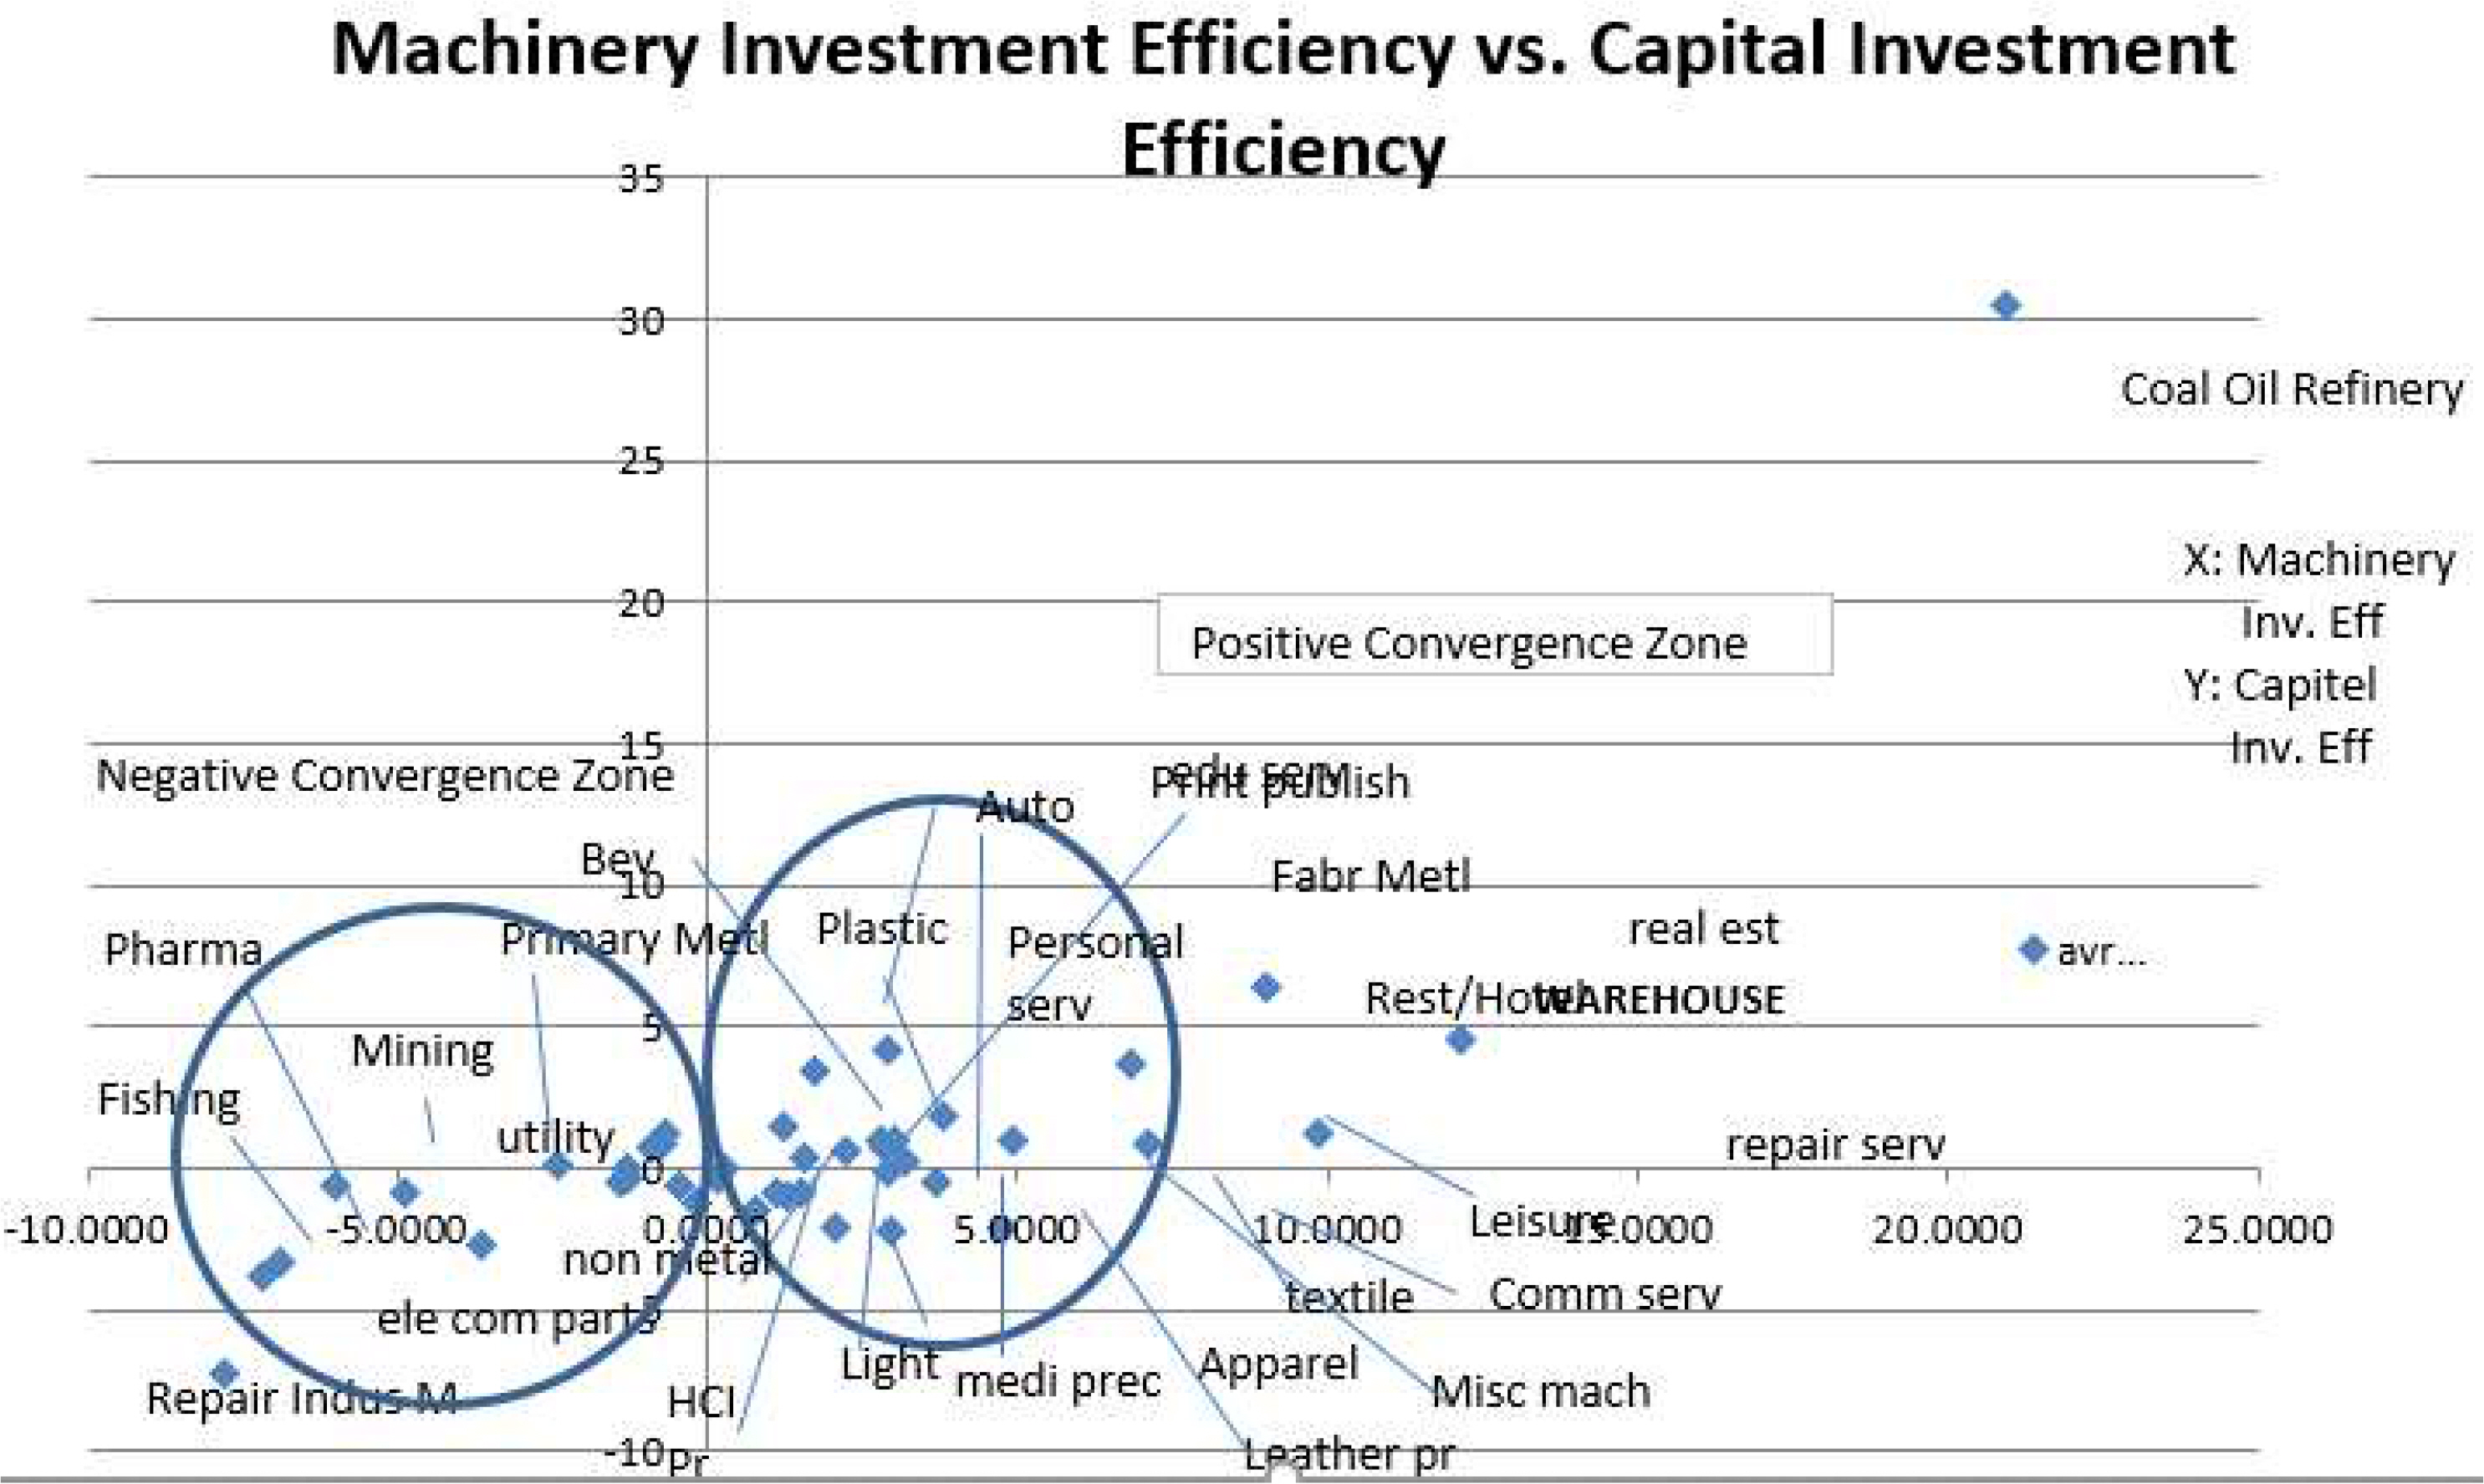
This research conducted a data analysis of two indicators in a times series format for the case of Korea, covering other industrial sectors from both manufacturing and service sector industries from 2009 to 2019. Average capital efficiency shows whether an industry features maximum out of investments it received whether the investments are financial, organizational or technological. In contrast, average efficiency of machinery investment focuses on technology related efficiency of a sector. By using the average capital efficiency and the average efficiency of machinery investment by industrial sector between 2009 and 2019, this research tried to distinguish those industrial groups that have been invested in the previous time period and those that are enjoying low investments from previous period. The background to distinguish the two groups is to address a phenomenon called the productivity paradox, which means productivity goes down despite heavy investment, which will need some time to digest the new technology. Productivity paradox occurs when a flux of heavy investment contains technological improvements. . In contrast, sectors that were less invested may show higher efficiency in both capital investment efficiency and machinery investment efficiency, but would hide potentials to be changed. By considering the average change rate over the tenyear period, the two indicators are plotted on the X–Y axis, as shown in Figure 1. The sectors included in the data analysis are listed in Table 1.
As section 3.1. mentioned, data in figure 1 covers a range of industrial sectors including both manufacturing and service sectors, and apparently one would classify
Industrial sectors based on convention, in other words standard industrial classification codes, assuming that similarly located sectors in SIC will mean that these sectors will behave similarly. If one can assume that industrial convergence can bring much more fluid combinations, then the reason for plotting figure 1 can be illustrated.
4.2. Findings From Time Series Data Plotting
4.2.1. Positive Convergence Zone
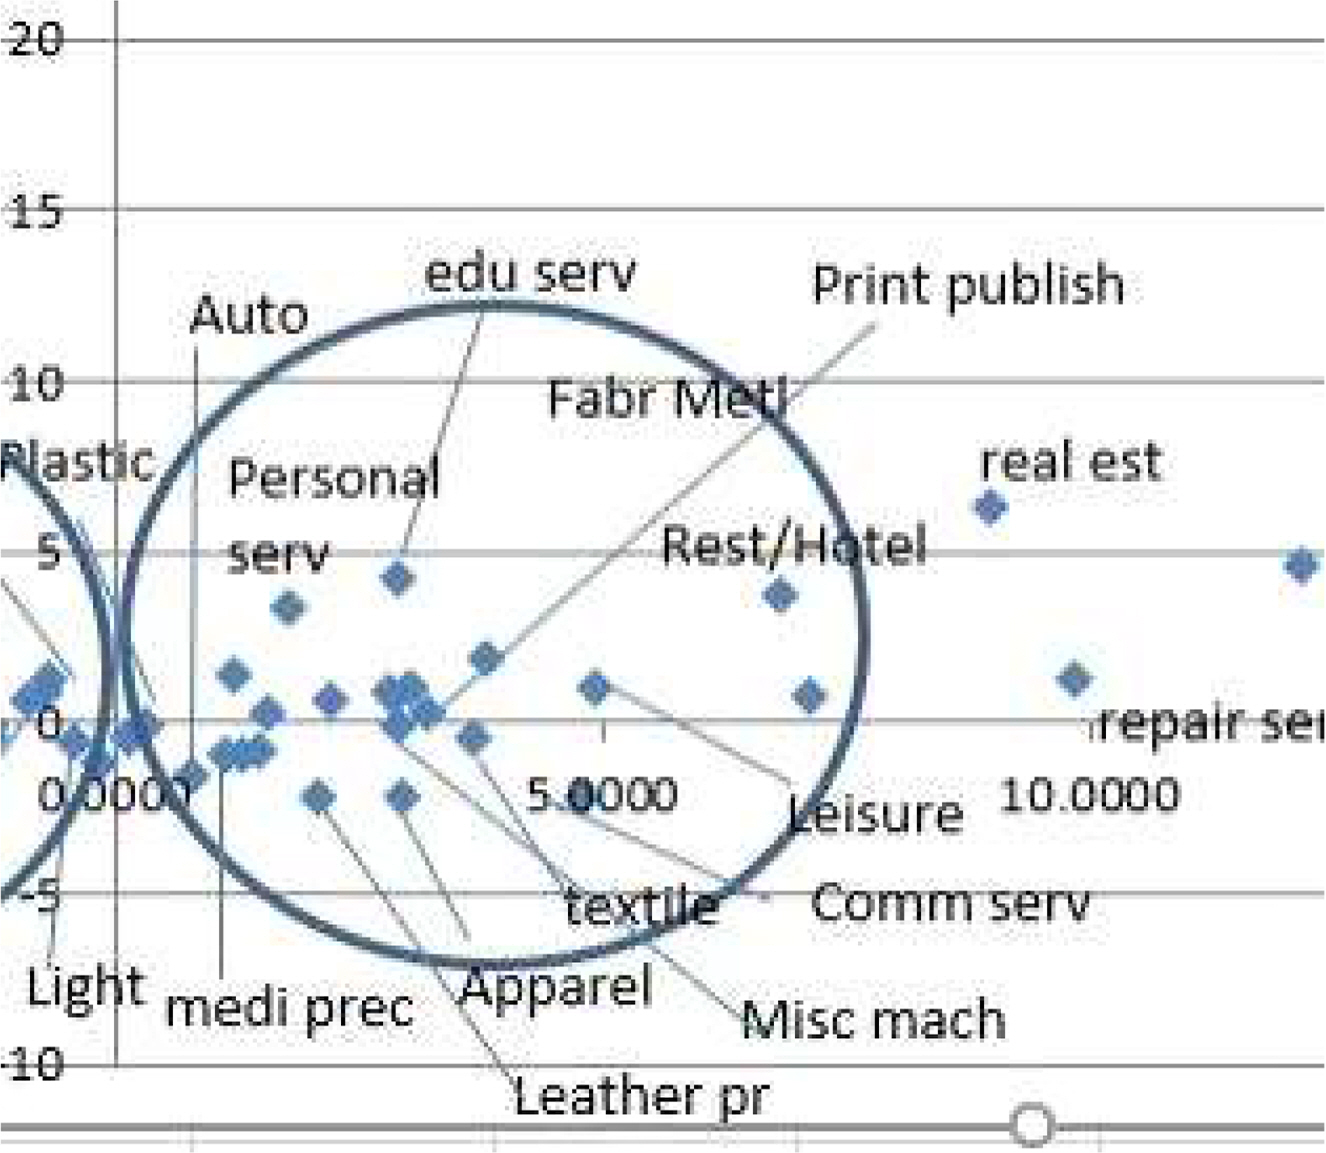
It is possible to obtain several empirical findings and their implications when understanding the trends toward the i-fashion-oriented industrial developments. First, in Figure 1, the vertical axis is the ten-year average capital efficiency, and the horizontal axis is the ten-year average machinery investment efficiency. If certain sectors are located in zone 1, which comprises positive machinery investment efficiency and capital investment efficiency, then these sectors are located in the positive convergence zone in the framework of this analysis. This implies that these sectors in this convergence zone have relied on existing technologies instead of newer ones, which resulted in the high and positive values for both indicators. Second, the existence of multiple sectors in the same convergence zone implies that these sectors may have incentives to move similarly, and furthermore, we may find technological convergence potentials.
The industrial sectors located in the positive convergence zone include textile, apparel, leather, miscellaneous machinery, communications service, medical precision equipment, fabricated metal products, educational service, restaurant/hotels, repair services, and print/publishing sectors. It can be understood from this composition that if there is a trend toward i-fashion, it will be easy to find these sectors to at least comove in a similar direction. Based on a bolder forecasting, these sectors may converge because of technological reasons to form a new sector targeting sectors such as i-manufacturing, including i-fashion.
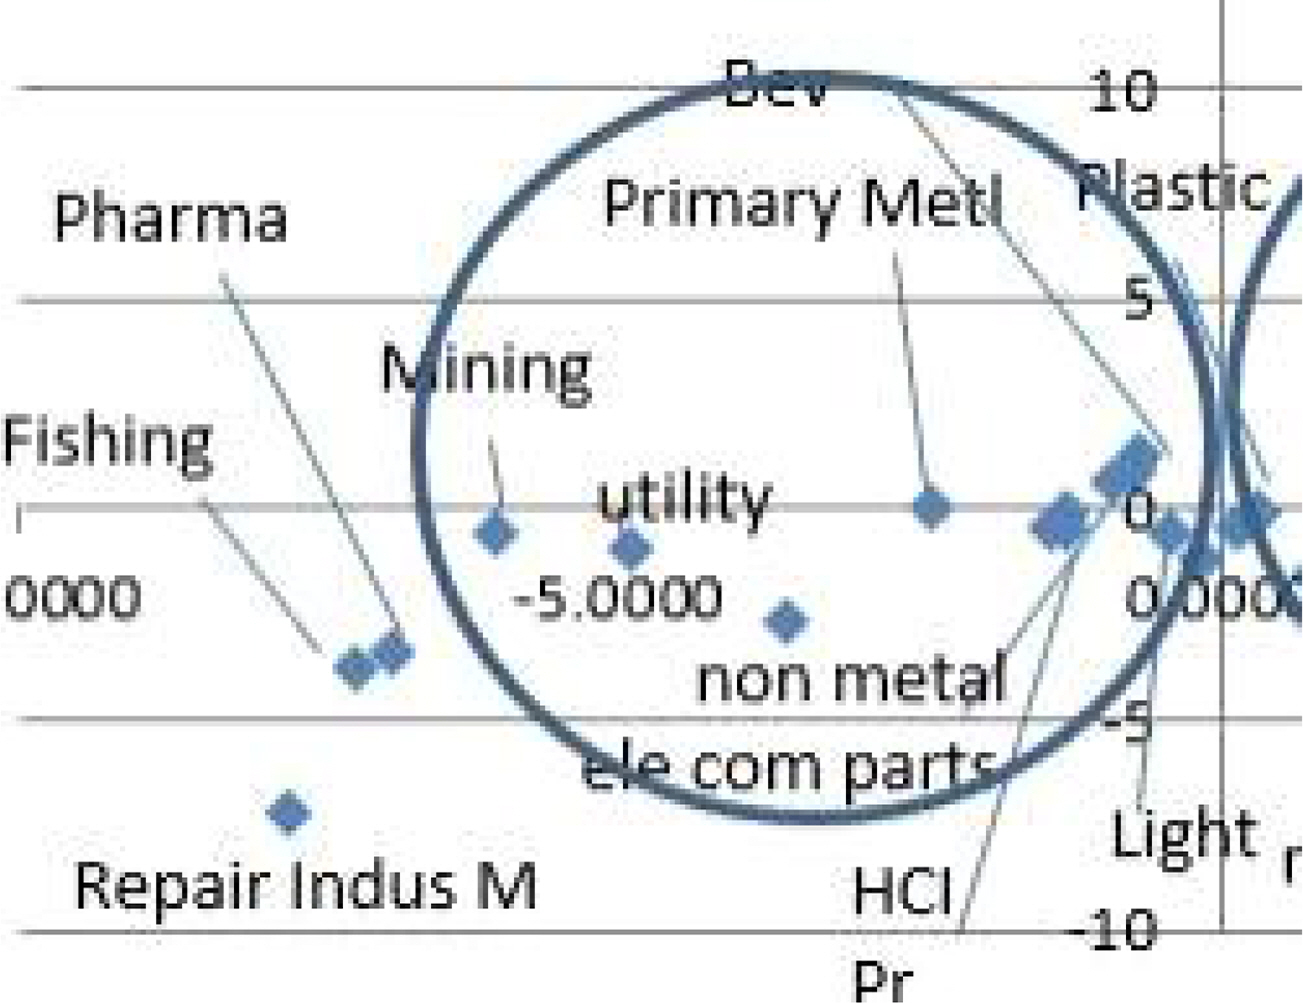
4.2.2. Negative Convergence Zone
Figure 1 also shows an agglomeration on the left hand side, which in this study is referred as the negative convergence zone. Although the literal meaning of this term is negative, the sectors located in this zone share a unique commonality across them. First, during the 2009–2019 period, most heavy and chemical sectors (HCI sectors) are located in this zone, except the electronic components sector. Second, that the sectors are located in the negative convergence zone does not necessarily imply that they present low industrial performance individually. Third, concurrently, being located in the negative convergence zone implies that these sectors have made massive technology/facility-related investments in the same period. One possible interpretation of this negative convergence zone is called the productivity paradox, in which a series of massive investments in one period results in a relatively low technology-related productivity of the same sectors in the coming period. This occurs because absorbing the full potential of the technology investment is time consuming, particularly in the embodied sectors, and tacit knowledge is important for actualizing the outcomes. The pharmaceutical, electronics component, mining, nonmetal products, and repair of industrial machinery sectors that are included in this zone validate the plausibility of the scenario.
4.2.3. Findings and Implications of Time Series Data-Tuned Cluster Analysis
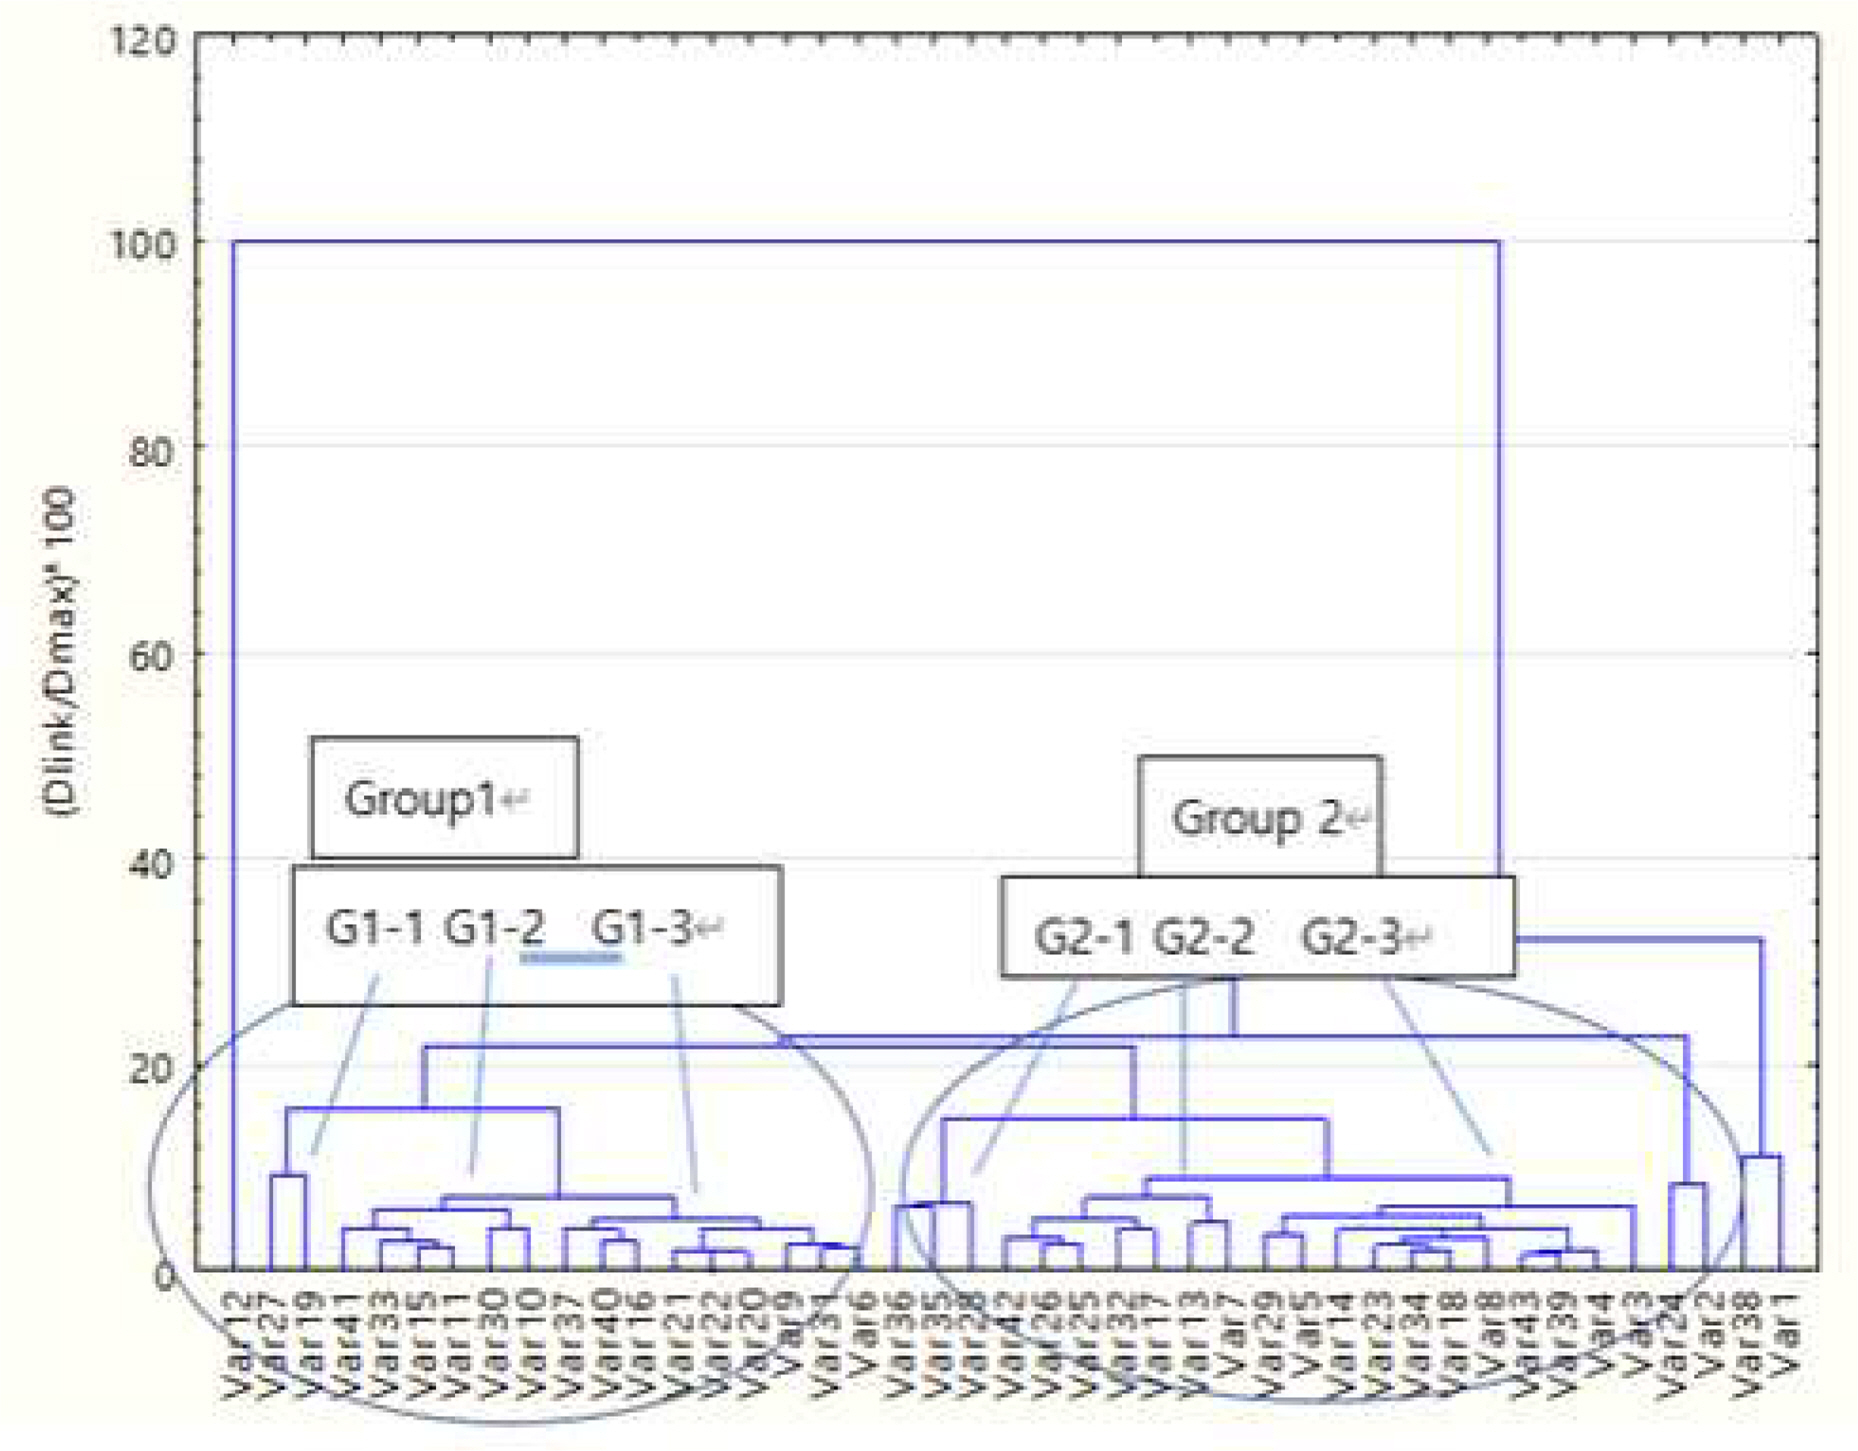
The findings and implications of industrial convergence obtained from the times series data plotting need to be validated by another method[27]. To achieve this, in this study, a time series data-tuned cluster analysis was conducted to identify ten-year time series-based patterns of the industrial sectors in Korea. While Figure 1 shows a one shot analysis based on the average change in ten years, cluster analysis yields an evolution-like trajectory of the sectors because of the use of the Euclidean distances among the sectors for each year and their total for ten years.
Figure 4 shows two large groups: group 1 on the left hand side and group 2 on the right hand side. Group 1 can contain subgroups called as groups 1-1, 1-2, and 1-3 from the left to the right, and similarly, group 2 can contain groups 2-1, 2-2, and 2-3. In group 1, a mixed location of the sectors that were in the negative and positive convergence zones is found. The reason for the mix is quite natural and helpful in understanding industrial dynamics. Figure 1 shows one shot outcomes, such as scenes, whereas the cluster tree map shows the annual change rate of the machinery investment efficiency. Therefore, the latter collects the sectors with similar cumulative annual changes in the machinery investment efficiency over the ten-year period.
Despite the differences, if and only if relevant agglomeration of the industrial sectors is found similar to both in Figures 1 and 4, it will be a highly convincing hypothesis and prediction that these sectors will move on the same trajectory in the future. Particularly if i-fashion-related sectors feature relevant cocollection in both Figures 1 and 4, then based on their analysis, one can clearly state that the necessary conditions for convergence toward i-fashion are approaching. In this context, sufficient conditions for i-fashion can be determined additionally based on the investment responses from social demands.
It is noteworthy that in Figure 4, the textile, electronic medical equipment, nonmetal products, and miscellaneous machinery sectors are under group 1, which is in significant agreement with Figure 1. This presents a strong reason to state that there is a technological potential that these sectors that present similar behavior in the industrial measures can be merged to form the i-fashion sector and its related technologies. The only difference is that Figure 4 shows the covariation of the sectors in a high-resolution manner, whereas Figure 1 presents a one shot photolike results.
5. Conclusion and Implications for i-Fashion
In this study, an empirical data analysis was conducted to show a potential and ongoing convergence of industrial sectors toward i-fashion. Although this study focused and utilized a Korean case, this methodology can be employed for the cases of other industrialized countries if the time series data can be obtained. One strong implication is that sectoral level convergence based on technology and industry is occurring, and i-fashion is one of the industrial convergence cases to be studied. Textile and apparel sectors were located in the positive convergence zone, which clearly hints that in the preceding time periods these sectors were underinvested technologically and financially. Why? Because capitalism runs on markets and profits, and market saturation was the fate. What was most impressive as a finding in this research was that those sectors previously underinvested due to a combination of technological and financial reasons found an exit for growth. In textile and apparel sectors, that could be the i-fashion. Instead of conducting hypothesis testing, the analysis in this study adopted a much more empirical as well as data-driven approach to show clear dynamics of the industries. With other approaches to be added in the future, industrial convergence dissections can be reported as an ongoing phenomenon.